. 2009 Jan;83(1):440-53.
doi: 10.1128/JVI.01864-08. Epub 2008 Oct 29.

Host cell factors and functions involved in vesicular stomatitis virus entry

Affiliations

Host cell factors and functions involved in vesicular stomatitis virus entry

Hrefna Kristin Johannsdottir et al. J Virol. 2009 Jan.

Abstract

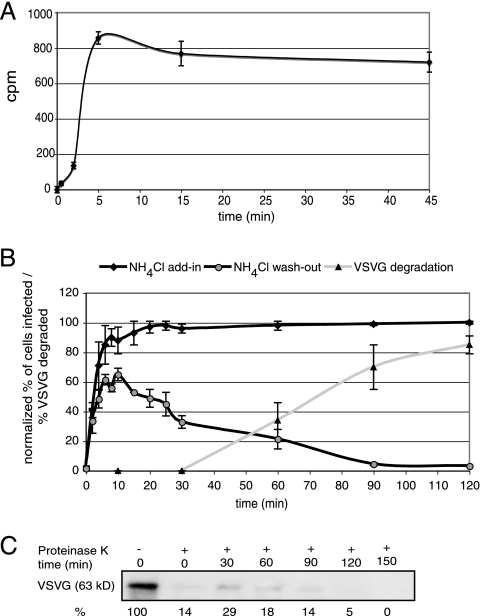
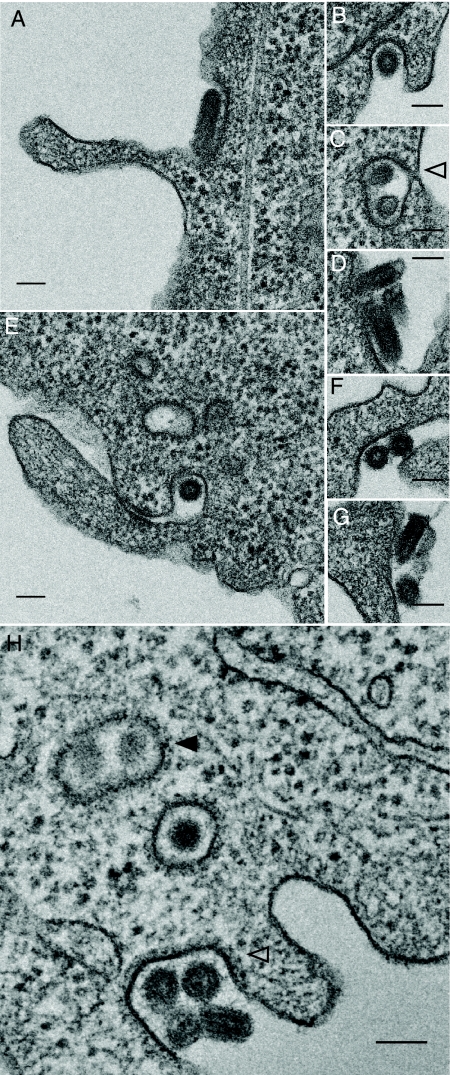
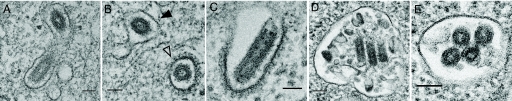
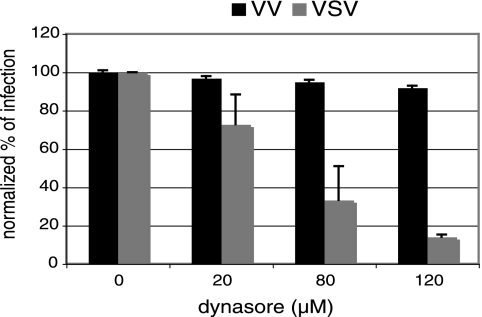
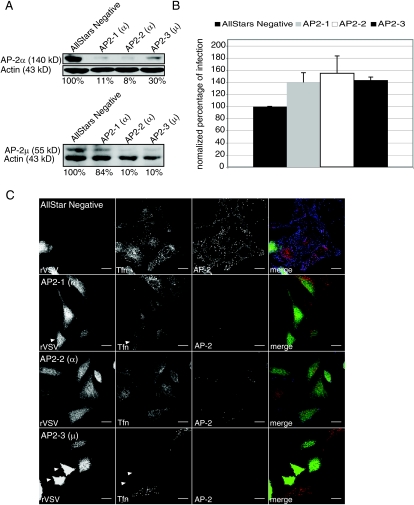
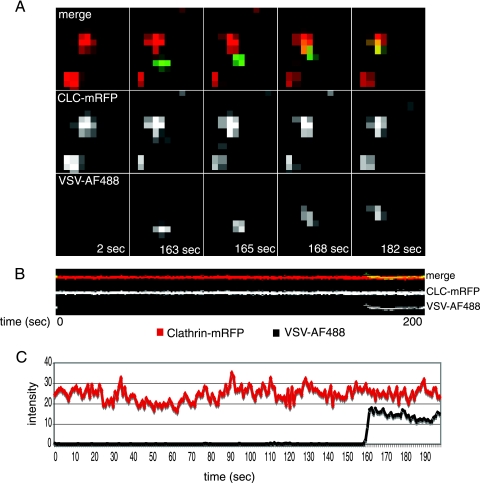
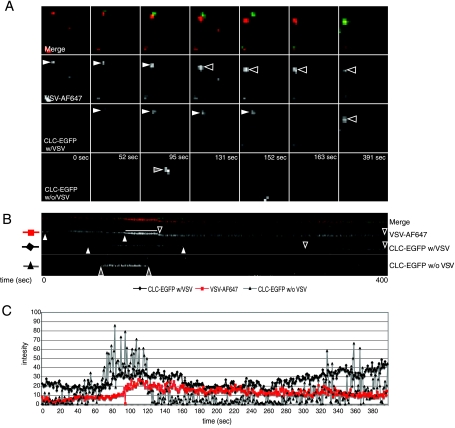
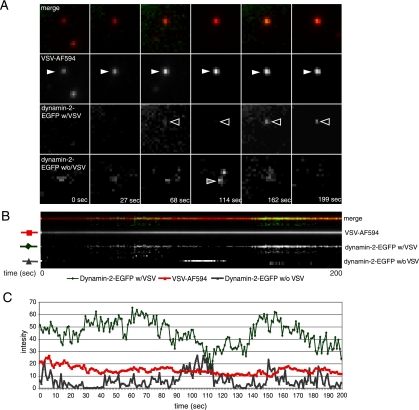
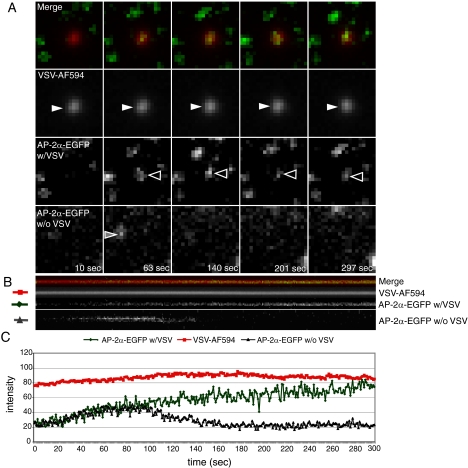
Vesicular stomatitis virus (VSV) is an animal virus that based on electron microscopy and its dependence on acidic cellular compartments for infection is thought to enter its host cells in a clathrin-dependent manner. The exact cellular mechanism, however, is largely unknown. In this study, we characterized the entry kinetics of VSV and elucidated viral requirements for host cell factors during infection in HeLa cells. We found that endocytosis of VSV was a fast process with a half time of 2.5 to 3 min and that acid activation occurred within 1 to 2 min after internalization in early endosomes. The majority of viral particles were endocytosed in a clathrin-based, dynamin-2-dependent manner. Although associated with some of the surface-bound viruses, the classical adaptor protein complex AP-2 was not required for infection. Time-lapse microscopy revealed that the virus either entered preformed clathrin-coated pits or induced de novo formation of pits. Dynamin-2 was recruited to plasma membrane-confined virus particles. Thus, VSV can induce productive internalization by exploiting a specific combination of the clathrin-associated proteins and cellular functions.


Figures

FIG. 1.
FIG. 1.
Entry kinetics of VSV in HeLa cells. (A) Internalization of prebound VSV. [35S]methionine-labeled VSV was bound to cells at 4°C. Unbound virus was removed, and the cells were shifted to a 37°C water bath for the indicated times. In these experiments, about 3,500 cpm was found to be cell associated and over 20% of the cell-associated virus became proteinase K resistant upon warming. After removal of remaining surface-associated viruses by proteinase K treatment, internalized virus was quantified using a scintillation counter. Error bars indicate the standard deviations for the means from three experiments. (B) Kinetics of acid activation of VSV and degradation of VSVG. VSV was bound to cells at 4°C. Unbound virus was removed, and samples were shifted to a 37°C water bath in the absence (NH4Cl add-in [diamonds]) or presence (NH4Cl wash out [circles]) of NH4Cl for the indicated times. Subsequently, NH4Cl was either added to the samples (NH4Cl add-in [diamonds]) or removed for 2 min and then readded (NH4Cl wash out [circles]) at the indicated time points. Infection was scored by FACS 4 h after warming and represented as a percentage of infected cells in the absence of NH4Cl. Error bars indicate standard deviations from three experiments. (C) VSVG degradation. VSV was bound to cells at 4°C. Unbound virus was removed, and samples were shifted to 37°C water bath in the presence of 1 mM cycloheximide for indicated times. Subsequently, the amount of internalized, undegraded VSVG was quantified by Western blot analysis (triangles in panel B). Error bars indicate standard errors of the means from three experiments.
FIG. 2.
FIG. 2.
Electron microscopy of VSV associated with the plasma membranes of BHK-21 cells. Virus was bound to cells at 4°C for 1 h. The cells were fixed and analyzed in thin sections. Some of the membrane-bound viruses were associated with electron-dense, cytoplasmic coats (A, B, C, D, and H), others were in uncoated indentations (E, F, and G). Many were close to or associated with microvilli (A, E, F, and G). Upon warming, viruses started to be internalized (H). In some cases, multiple viral particles were seen within a single coated pit (open arrowheads in panels C and H) or coated vesicle (closed arrowhead in panel H). Bars, 100 nm.
FIG. 3.
FIG. 3.
Electron microscopy of VSV in endocytic vesicles. Virus was bound to BHK-21 cells at 4°C for 1 h, and the cells were shifted to a 37°C incubator to allow internalization. Viruses were seen either in coated or partly coated endocytic vesicles (B [open arrowhead] and C) or in relatively small, tight fitting endosomal vesicles (A and B [closed arrowhead]), indicating their presence in early endosomal compartments. (D and E) Warming was performed in the presence of 20 mM NH4Cl to allow internalization but not acid-activated fusion. Accumulation of viruses was seen in larger endosomal structures, some containing internal vesicles. Bars, 100 nm.
FIG. 4.
FIG. 4.
VSV infection is dynamin-2 dependent. HeLa cells were infected with VSV and vaccinia virus (VV) in the presence of the indicated concentrations of dynasore. Infection was detected by FACS and normalized to infection of untreated cells. Error bars indicate standard deviations of three experiments.
FIG. 5.
FIG. 5.
VSV infection is not dependent on AP-2. HeLa cells were transfected with siRNAs against AP-2α (AP2-1 and AP2-2) or AP-2μ (AP2-3). (A) Quantification of AP-2α (top panel) and AP-2μ (bottom panel) protein levels in siRNA-treated cells by Western blotting. Results are presented as percentages of AP-2 levels in cells treated with AP2-1, -2, or -3 siRNAs normalized to AP-2 levels in control cells treated with AllStars negative-control siRNA and the level of actin, which was used as a loading control. (B) Cells treated with AP2-1 to AP2-3 were infected with rVSV, the infection was scored by FACS, and the resulting values were normalized to the infection levels of cells treated with AllStars negative-control siRNA. Error bars represent standard deviations from three experiments. (C) Cells treated with AP2-1, -2, and -3 siRNAs or AllStars negative-control siRNA were infected with rVSV for 4 h. AF594-labeled Tfn was added to the samples for 15 min, 25 min prior to fixation. AP-2α and AP-2μ levels were detected using a mouse anti-AP-2α and AP-2μ antibody, respectively, and an AF647-labeled secondary antibody. Infection was detected by GFP expression upon rVSV replication. Bars, 10 μm.
FIG. 6.
FIG. 6.
VSV can be targeted into preformed CCPs. AF488-labeled VSV was added to HeLa cells expressing CLC-mRFP, and live-cell imaging was performed by TIRFM. (A) Time series, (B) kymographs, and (C) intensity graphs show how the labeled VSV appears in the TIRF field from the surrounding medium and colocalizes with a stable CCP.
FIG. 7.
FIG. 7.
VSV can induce the formation of CCPs. AF647-labeled VSV (pseudocolored red) and HeLa cells expressing CLC-EGFP were subjected to live-cell imaging by TIRFM. (A) Time series show a confined viral particle (white arrowhead in VSV-AF647) and the recruitment of clathrin underneath it (white arrowhead in CLC-EGFP with VSV [w/VSV] at 52 seconds). The virus then detaches and relocates (black arrowhead in VSV-AF647 at 131 s), and shortly thereafter, the pit collapses (CLC-EGFP w/VSV at 152 to163 seconds). Upon reconfinement of the virus (black arrowhead in VSV-AF647 at 131 s), a new clathrin-coated pit appears under the viral particle (black arrowhead in CLC-EGFP w/VSV at 391 s). The bottom row shows time series of CCP without virus (w/o VSV) association (gray arrowhead in CLC-EGFP w/o VSV at 95 s). (B) Kymographs of the same events as in panel A. White arrowheads indicate appearance and disappearance of virus and CLC signal at the initial location of confinement, and black arrowheads indicate the parallel events at the second location. The bar between the white arrowhead (indicating disappearance of the virus from the first location) and the black arrowhead (indicating its appearance at the second one) depicts the time frame of viral movement within the plane of the plasma membrane. (C) Intensity graphs show the change in intensity over time for the virus particle (red squares), virus-associated clathrin (green diamonds), and the virus-independent CCP (gray triangles).
FIG. 8.
FIG. 8.
Dynamin is recruited to plasma membrane-bound VSV. AF594-labeled VSV and dynamin-2-EGFP-expressing HeLa cells were subjected to live-cell imaging by TIRFM. (A) Time series show a confined viral particle (white arrowhead in VSV-AF594) and the recruitment of dynamin underneath it (black arrowhead in dynamin-2-EGFP with VSV [w/VSV] at 68 seconds). Over time, dynamin signal becomes weaker (dynamin-2-EGFP w/VSV at 114 s) but then gains again in strength (black arrowhead in dynamin-2-EGFP w/VSV at 162 s). The bottom row shows time series of plasma membrane recruitment of dynamin independent of VSV (gray arrowhead in dynamin-2-EGFP without VSV [w/o VSV] at 114 s). (B) Kymographs of the same events as described above for panel A. (C) Intensity graphs show the change in intensity over time for the virus particle (red squares), its associated dynamin (green diamonds) and the virus-independent plasma membrane recruitment of dynamin (gray triangles).
FIG. 9.
FIG. 9.
AP-2 colocalizes with VSV at the plasma membrane but is probably not recruited by the virus. AF594-labeled VSV and AP-2α-EGFP-expressing HeLa cells were subjected to live-cell imaging by TIRFM. (A) Time series of plasma membrane-bound virus (white arrowheads in VSV-AF594) and its colocalization with AP-2α (black arrowheads in AP-2α-EGFP with VSV [w/VSV] from 63 seconds). The lowest row shows the recruitment of AP-2α to the plasma membrane independent of VSV (gray arrowhead in AP-2α-EGFP without VSV [w/o VSV] at 63 s). (B) Kymographs of the same events as shown in the time series. (C) Intensity graphs show the change in intensity over time for the virus particle (red squares), the colocalizing AP2α (green diamonds), and the virus-independent AP-2α (gray triangles) at the plasma membrane.

References

    1. Bayer, N., D. Schober, E. Prchla, R. F. Murphy, D. Blaas, and R. Fuchs. 1998. Effect of bafilomycin A1 and nocodazole on endocytic transport in HeLa cells: implications for viral uncoating and infection. J. Virol. 729645-9655. - PMC - PubMed
    1. Brindley, M. A., and W. Maury. 2008. Equine infectious anemia virus entry occurs through clathrin-mediated endocytosis. J. Virol. 821628-1637. - PMC - PubMed
    1. Burns, J. C., T. Friedmann, W. Driever, M. Burrascano, and J. K. Yee. 1993. Vesicular stomatitis virus G glycoprotein pseudotyped retroviral vectors: concentration to very high titer and efficient gene transfer into mammalian and nonmammalian cells. Proc. Natl. Acad. Sci. USA 908033-8037. - PMC - PubMed
    1. Carneiro, F. A., M. L. Bianconi, G. Weissmuller, F. Stauffer, and A. T. Da Poian. 2002. Membrane recognition by vesicular stomatitis virus involves enthalpy-driven protein-lipid interactions. J. Virol. 763756-3764. - PMC - PubMed
    1. Carneiro, F. A., A. S. Ferradosa, and A. T. Da Poian. 2001. Low pH-induced conformational changes in vesicular stomatitis virus glycoprotein involve dramatic structure reorganization. J. Biol. Chem. 27662-67. - PubMed

Publication types