. 2009 Jan;83(2):847-58.
doi: 10.1128/JVI.02008-08. Epub 2008 Oct 29.

Activation of pattern recognition receptor-mediated innate immunity inhibits the replication of hepatitis B virus in human hepatocyte-derived cells

Affiliations

Activation of pattern recognition receptor-mediated innate immunity inhibits the replication of hepatitis B virus in human hepatocyte-derived cells

Haitao Guo et al. J Virol. 2009 Jan.

Abstract

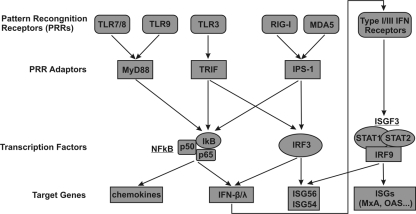
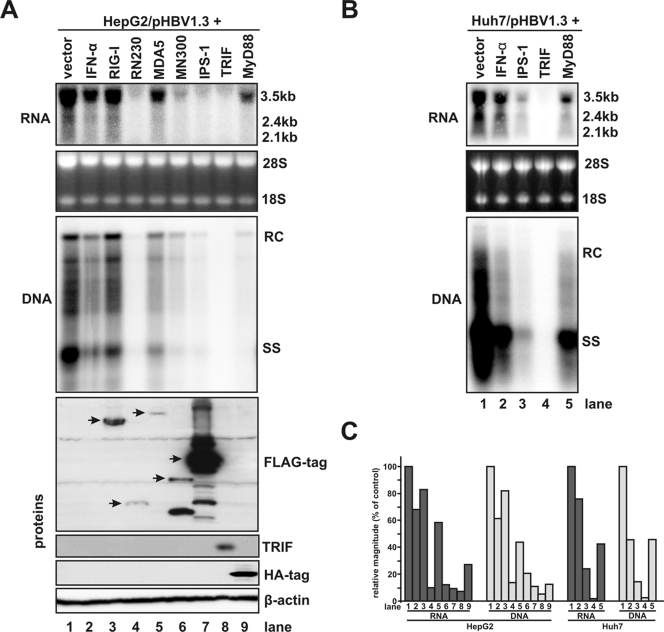
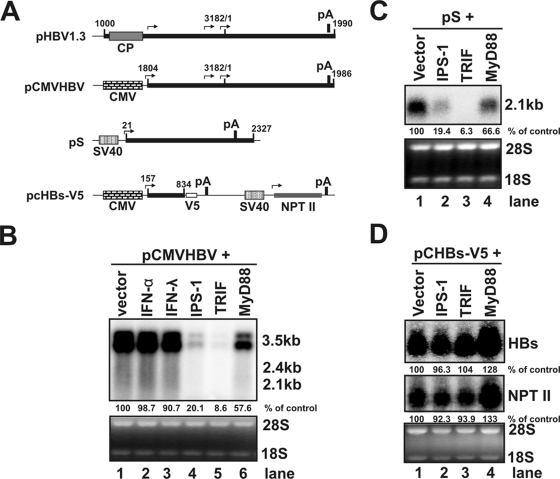
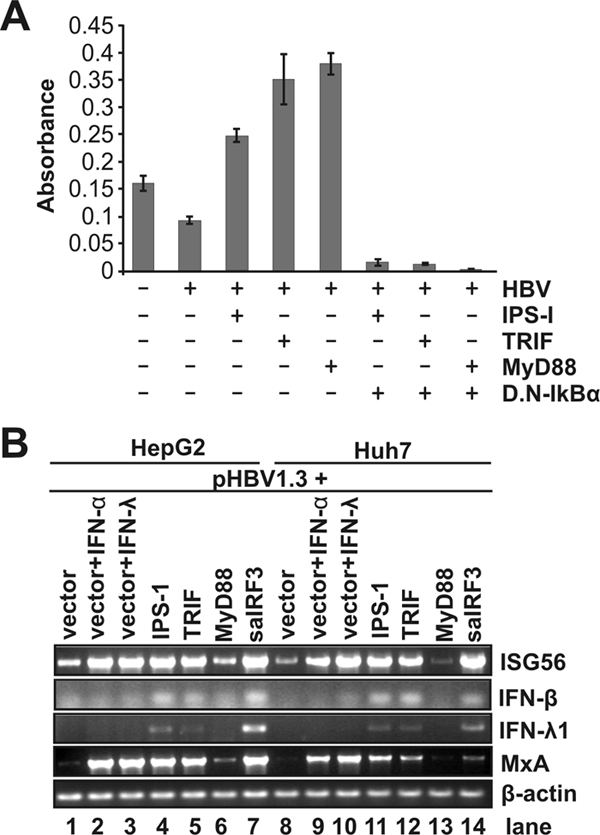
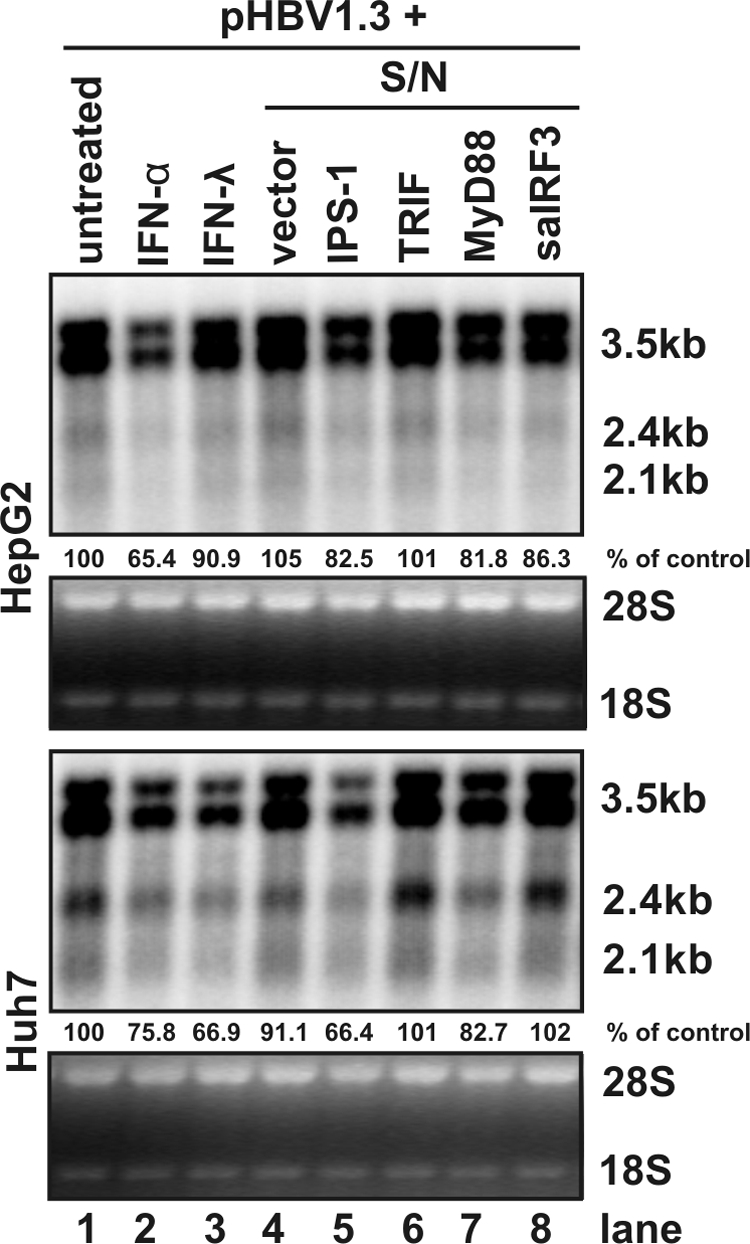
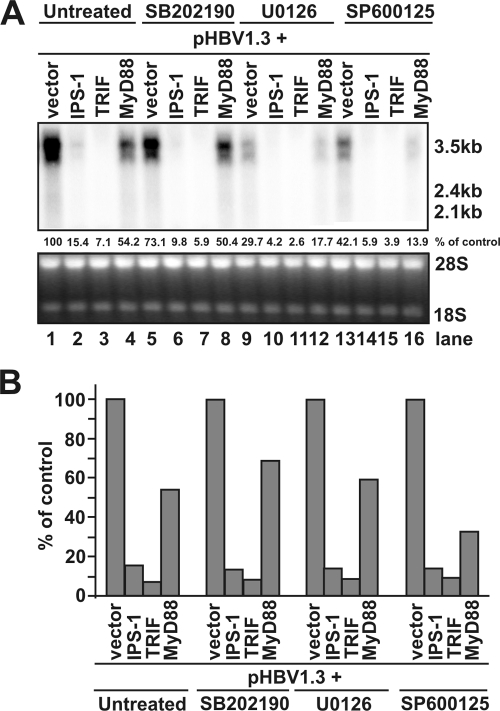
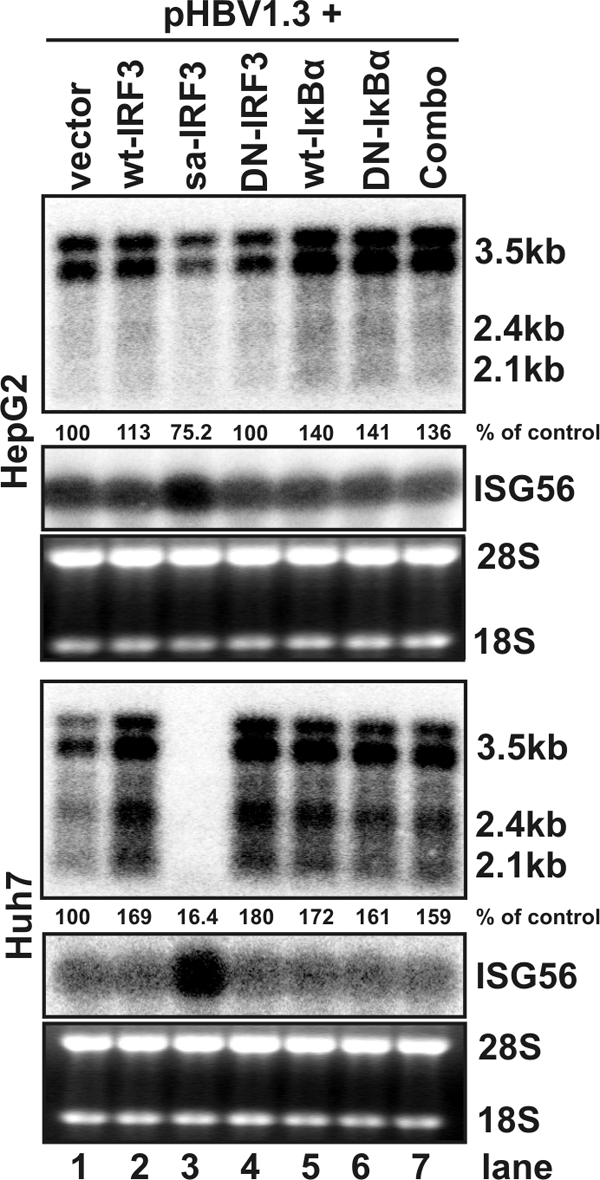
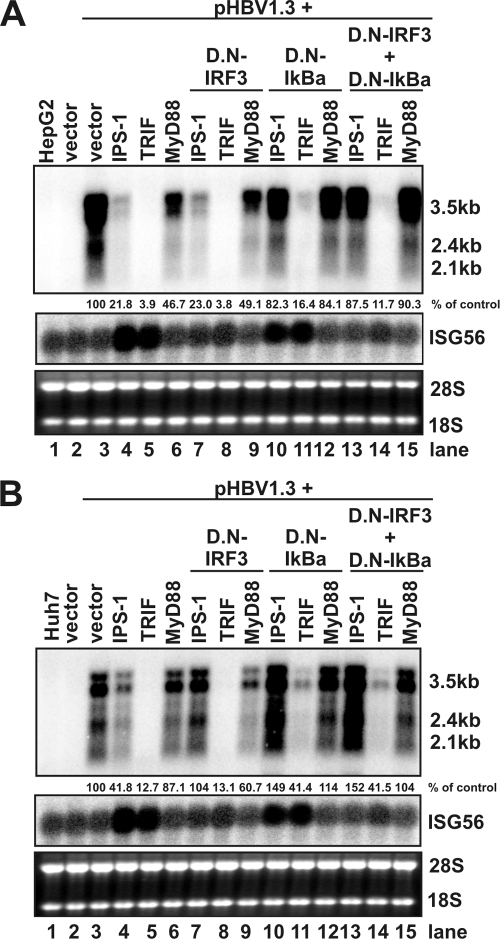
Recognition of virus infections by pattern recognition receptors (PRRs), such as Toll-like receptors (TLRs), retinoic acid-inducible gene I (RIG-I), and melanoma differentiation associated gene 5 (MDA5), activates signaling pathways, leading to the induction of inflammatory cytokines that limit viral replication. To determine the effects of PRR-mediated innate immune response on hepatitis B virus (HBV) replication, a 1.3mer HBV genome was cotransfected into HepG2 or Huh7 cells with plasmid expressing TLR adaptors, myeloid differentiation primary response gene 88 (MyD88), and TIR-domain-containing adaptor-inducing beta interferon (TRIF), or RIG-I/MDA5 adaptor, interferon promoter stimulator 1 (IPS-1). The results showed that expressing each of the three adaptors dramatically reduced the levels of HBV mRNA and DNA in both HepG2 and Huh7 cells. However, HBV replication was not significantly affected by treatment of HBV genome-transfected cells with culture media harvested from cells transfected with each of the three adaptors, indicating that the adaptor-induced antiviral response was predominantly mediated by intracellular factors rather than by secreted cytokines. Analyses of involved signaling pathways revealed that activation of NF-kappaB is required for all three adaptors to elicit antiviral response in both HepG2 and Huh7 cells. However, activation of interferon regulatory factor 3 is only essential for induction of antiviral response by IPS-1 in Huh7 cells, but not in HepG2 cells. Furthermore, our results suggest that besides NF-kappaB, additional signaling pathway(s) are required for TRIF to induce a maximum antiviral response against HBV. Knowing the molecular mechanisms by which PRR-mediated innate defense responses control HBV infections could potentially lead to the development of novel therapeutics that evoke the host cellular innate antiviral response to control HBV infections.


Figures

FIG. 1.
FIG. 1.
Schematic representation of the major viral pattern recognition receptor-mediated signaling pathways. The three PRR adaptors and their relationship with the two downstream transcription factors (NF-κB and IRF3) and the activated target genes examined in the present study are illustrated. See the text for more detailed discussion.
FIG. 2.
FIG. 2.
Overexpression of the CARD domain of RIG-I or MDA5 and three adaptor proteins—IPS-1, TRIF, and MyD88—potently inhibits HBV replication in human hepatocyte-derived tumor cell lines. (A) A plasmid that encodes pgRNA of wild-type HBV (pHBV1.3) was cotransfected with control plasmid (lane 1) or plasmids that express RIG-I (lane 3), CARD of RIG-I (RN230, lane 4), MDA5 (lane 5), CARD of MDA5 (MN300, lane 6), IPS-1 (lane 7), TRIF (lane 8), or MyD88 (lane 9) into HepG2 cells. In these transfection experiments, 2 μg of pHBV1.3 was cotransfected with 2 μg of control plasmid or 1 μg of control plasmid plus 1 μg of plasmid expressing proteins under investigation into a 35-mm dish of cells. Lane 1 was loaded with sample derived from pHBV1.3 and control plasmid cotransfected cells, and lane 2 is loaded with samples derived from pHBV1.3 and control plasmid cotransfected cells treated with 500 IU of IFN-α/ml, which is added 12 h after transfection. Cells were harvested at 4 day after transfection, and the levels of viral RNAs and core-associated DNA were determined by Northern (upper panel) and Southern (middle panel) blot hybridization analyses, respectively. For RNA analysis, each lane was loaded with 10 μg of total RNA. rRNAs (28S and 18S) were presented as loading controls. The positions of the HBV 3.5-, 2.4-, and 2.1-kb RNAs are indicated. For DNA analysis, HBV core DNA was probed with a genome-length, minus-strand-specific HBV riboprobe. The positions of relaxed circular (RC), single-stranded (SS) DNAs are indicated. Proper expression of intended proteins by the transfected plasmids was confirmed by Western blot analysis with the antibodies described in Materials and Methods, and the levels of β-actin serve as loading controls (lower panel). (B) Huh7 cells were cotransfected with 2 μg of pHBV1.3 and 2 μg of control plasmid (lane 1 and 2) or 1 μg of control plasmid plus 1 μg of plasmid expressing IPS-1 (lane 3), TRIF (lane 4) and MyD88 (lane 5). One set of the control plasmid transfected cells (lane 2) was treated with 500 IU of IFN-α/ml at 12 h after transfection. Cells were harvested at 4 day after transfection, and the levels of viral RNAs and core-associated DNA were determined as described above. (C) Levels of HBV mRNAs and DNA in panels A and B were determined by using a phosphorimager with QuantityOne software (Bio-Rad) and plotted as the percentage of the RNA or DNA levels in control cells that were cotransfected with pHBV1.3 and vector plasmids (lane 1).
FIG. 3.
FIG. 3.
Reduction of HBV RNA levels induced by the innate immune responses does not depend on the nature of the promoters. (A) Schematic representation of the RNA species and the corresponding promoter that directs the RNA transcription in the plasmids used in the present study. The numbers indicate the HBV DNA sequence with 1 at the unique EcoRI site of HBV genome. (B) HepG2 cells were cotransfected with 2 μg of pCMV-HBV and 2 μg of control plasmid (lanes 1 to 3) or 1 μg of control plasmid plus 1 μg of plasmid expressing IPS-1 (lane 4), TRIF (lane 5), and MyD88 (lane 6). The control plasmid cotransfected cells were left untreated (lane 1) or treated with 500 IU of IFN-α/ml (lane 2) and 400 ng of IFN-λ1/ml (lane 3), respectively. Cells were harvested at 4 day after transfection, and the levels of viral RNAs were determined by Northern blot hybridization. rRNAs (28S and 18S) were presented as loading controls. The positions of the HBV 3.5-, 2.4-, and 2.1-kb RNAs are indicated. (C) HepG2 cells were cotransfected with 2 μg of pS and 2 μg of control plasmid (lane 1) or 1 μg of control plasmid plus 1 μg of plasmid expressing IPS-1 (lane 2), TRIF (lane 3), and MyD88 (lane 4), respectively. Cells were harvested at 2 day after transfection, and the levels of HBV 2.1-kb mRNA were determined by Northern blot hybridization. rRNAs (28S and 18S) were presented as loading controls. (D) HepG2 cells were cotransfected with 2 μg of pcHBs-V5 and 2 μg of control plasmid (lane 1) or 1 μg of control plasmid plus 1 μg of plasmid expressing IPS-1 (lane 2), TRIF (lane 3), and MyD88 (lane 4), respectively. Cells were harvested at 2 day after transfection, and the levels of 1-kb HBV mRNA and 0.8-kb neomycin phosphotransferase II (NTP II) mRNA were determined by Northern blot hybridization. rRNAs (28S and 18S) were used as loading controls. The relative RNA level in each sample is expressed as the percentage of RNA level in control cells cotransfected with vector plasmid (lane 1 of Fig. 3B, C, and D) and is given underneath each of the blots.
FIG. 4.
FIG. 4.
Expression of the three adaptor proteins activates desired intracellular signaling pathways. (A) NF-κB DNA-binding assay. Huh7 cells were untransfected or transfected with the indicated plasmids. After 2 days, 2.5 μg of the nuclear extract was subjected to the p65 DNA-binding ELISA according to the manufacturer's direction. (B) HepG2 (lanes 1 to 7) or Huh7 (lanes 8 to 14) cells were cotransfected with 2 μg of pHBV1.3 and 2 μg of control plasmid (lanes 1 to 3 and lanes 8 to 10) or 1 μg of control plasmid plus 1 μg of plasmid expressing IPS-1 (lanes 4 and 11), TRIF (lanes 5 and 12), MyD88 (lanes 6 and 13), and constitutively active IRF3 (saIRF3, lanes 7 and 14), respectively. Cells were harvested 2 days after transfection, and the levels of ISG56, IFN-β, IFN-λ1, MxA, and β-actin mRNAs were determined by reverse transcription-PCR assay.
FIG. 5.
FIG. 5.
Antiviral effects induced by the innate immune response are intracellular events but not mediated by secreted cytokines. HepG2 (upper panel) and Huh7 (lower panel) cells were transfected with 1.6 μg of pHBV1.3 per well in 12-well plates. At 12 h after the transfection, culture media were replaced with fresh DMEM/F12 (lane 1), fresh DMEM/F12 containing 500 IU of IFN-α/ml (lane 2) or 400 ng of IFN-λ1/ml (lane 3), or conditioned media prepared by combination of equal volumes of fresh DMEM/F12 with medium harvested from HepG2 and Huh7 cells transfected with control plasmid (lane 4) or plasmid expressing IPS-1 (lane 5), TRIF (lane 6), MyD88 (lane 7), or saIRF3 (lane 8). The transfected cells were cultured for an additional 48 h with the same medium change at 24 h under the condition described above and then harvested for total RNA extraction. The levels of HBV RNA were determined by Northern blot hybridization. rRNAs (28S and 18S) were presented as loading controls. Relative RNA level in each sample is expressed as the percentage of RNA level in control cells cotransfected with pHBV1.3 and vector plasmid, but left untreated (lane 1), and is presented underneath each of the blots.
FIG. 6.
FIG. 6.
The three major MAPKs are not involved in the inhibition of HBV replication by the innate immune response. (A) HepG2 cells were cotransfected with 2 μg of pHBV1.3 and 2 μg of control plasmid (lanes 1, 5, 9, and 13) or 1 μg of control plasmid plus 1 μg of plasmid expressing IPS-1 (lanes 2, 6, 10, and 14), TRIF (lanes 3, 7, 11, and 15), and MyD88 (lanes 4, 8, 12, and 16). Twelve hours after transfection, cells were left untreated (lanes 1 to 4) or treated with 25 μM MAPK p38 inhibitor SB202190 (lanes 5 to 8), 10 μM ERK inhibitor U0126 (lanes 9 to 12), or 25 μM JNK inhibitor SP600125 (lanes 13 to 16). The dimethyl sulfoxide concentration in all experiment groups was normalized at 0.1%. Culture media and the inhibitor were replaced every other day, and cells were harvested at day 4 after transfection. Total RNA was extracted and analyzed by Northern blot hybridization. rRNAs served as loading control. The RNA level in each sample is expressed as the percentage of RNA level in control cells cotransfected with pHBV1.3 and vector plasmid, but left untreated (lane 1). (B) RNA levels in the adaptor-expressing plasmids transfected cells were plotted as the percentage of that in cells cotransfected with pHBV1.3 and vector plasmid and left untreated (lane 1) or treated with the indicated kinase inhibitors in the absence of adaptor protein overexpression (lanes 5, 9, or 13), respectively.
FIG. 7.
FIG. 7.
Antiviral effects of IRF3 and NF-κB-mediated signaling pathways in HepG2 and Huh7 cells. HepG2 (upper panel) or Huh7 (lower panel) cells were cotransfected with 2 μg of pHBV1.3 and 2 μg of control plasmid (lane 1) or plasmid expressing wild-type IRF3 (lane 2), saIRF3 (lane 3), DN-IRF3 (lane 4), wild-type IκBα (lane 5), DN-IκBα (lane 6), or DN-IRF3 and DN-IκB-α in combination (lane 7). Cells were harvested at 4 day after transfection, and the levels of viral RNAs were determined by Northern blot hybridization analysis. Induction of ISG56 mRNA serves as an indicator of IRF3 activation in transfected cells. rRNAs (28S and 18S) were presented as loading controls. The positions of the HBV 3.5-, 2.4-, and 2.1-kb RNAs are indicated. The relative RNA level in each sample is expressed as the percentage of RNA level in control cells cotransfected with pHBV1.3 and vector plasmid (lane 1) and is given underneath each of the blots.
FIG. 8.
FIG. 8.
Role of IRF3 and NF-κB in mediating the antiviral response elicited by host cellular innate immunity. HepG2 (A) or Huh7 (B) cells in a 35-mm-diameter dish were either left untreated (lane 1), transfected with 4 μg of control plasmid (lane 2), or cotransfected with 4 μg of plasmids containing 2 μg of pHBV1.3, 1 μg of plasmid expressing each of the three adaptors, and 1 μg of plasmid expressing DN-IRF3 and/or DN-IκBα, plus 1 μg of control plasmid (omitted when DN-IRF3 and DN-IκBα were in combination). Cells were harvested 4 days after transfection, and the levels of viral RNAs were determined by Northern blot hybridization. Induction of ISG56 mRNA serves as an indicator of IRF3 activation in transfected cells. rRNAs (28S and 18S) were presented as loading controls. The positions of the HBV 3.5-, 2.4-, and 2.1-kb RNAs are indicated. The RNA level in each sample is expressed as the percentage of that in control cells cotransfected with pHBV1.3 and vector plasmid (lane 3) and is given underneath the blots.

Similar articles

Cited by

References

    1. Akira, S., S. Uematsu, and O. Takeuchi. 2006. Pathogen recognition and innate immunity. Cell 124783-801. - PubMed
    1. Alexopoulou, L., A. C. Holt, R. Medzhitov, and R. A. Flavell. 2001. Recognition of double-stranded RNA and activation of NF-κB by Toll-like receptor 3. Nature 413732-738. - PubMed
    1. Ambros, V. 2004. The functions of animal microRNAs. Nature 431350-355. - PubMed
    1. Bartel, D. P. 2004. MicroRNAs: genomics, biogenesis, mechanism, and function. Cell 116281-297. - PubMed
    1. Bigger, C. B., K. M. Brasky, and R. E. Lanford. 2001. DNA microarray analysis of chimpanzee liver during acute resolving hepatitis C virus infection. J. Virol. 757059-7066. - PMC - PubMed

Publication types

LinkOut - more resources