. 2008 Dec;18(12):1969-78.
doi: 10.1101/gr.074070.107. Epub 2008 Oct 29.

DNA methylation profile of tissue-dependent and differentially methylated regions (T-DMRs) in mouse promoter regions demonstrating tissue-specific gene expression

Affiliations

DNA methylation profile of tissue-dependent and differentially methylated regions (T-DMRs) in mouse promoter regions demonstrating tissue-specific gene expression

Shintaro Yagi et al. Genome Res. 2008 Dec.

Abstract

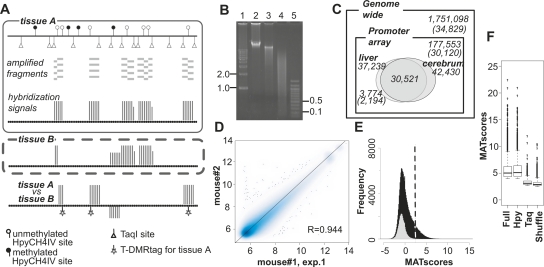
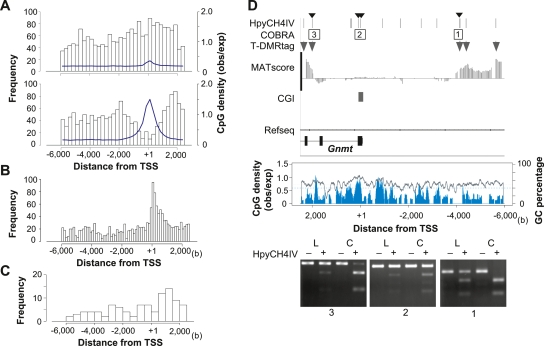
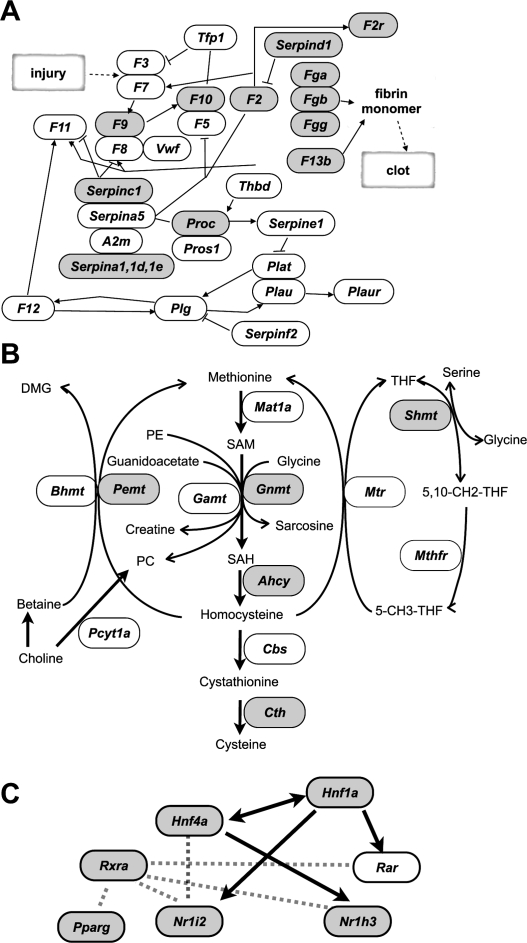
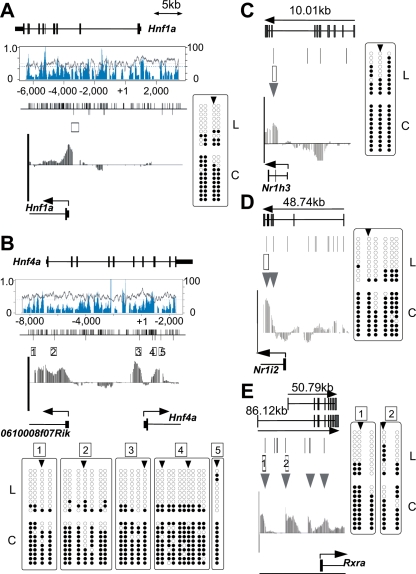
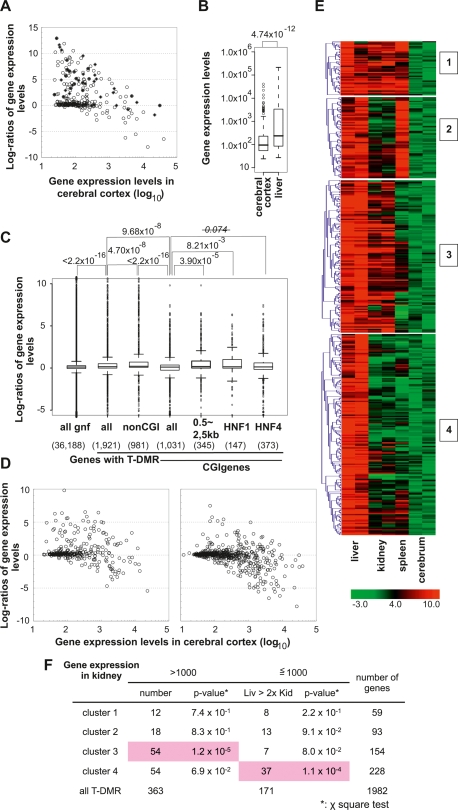
DNA methylation constitutes an important epigenetic regulation mechanism in many eukaryotes, although the extent of DNA methylation in the regulation of gene expression in the mammalian genome is poorly understood. We developed D-REAM, a genome-wide DNA methylation analysis method for tissue-dependent and differentially methylated region (T-DMR) profiling with restriction tag-mediated amplification in mouse tissues and cells. Using a mouse promoter tiling array covering a region from -6 to 2.5 kb ( approximately 30,000 transcription start sites), we found that over 3000 T-DMRs are hypomethylated in liver compared to cerebrum. The DNA methylation profile of liver was distinct from that of kidney and spleen. This hypomethylation profile marked genes that are specifically expressed in liver, including key transcription factors such as Hnf1a and Hnf4a. Genes with T-DMRs, especially those lacking CpG islands and those with HNF-1A binding motifis in their promoters, showed good correlation between their tissue-specific expression and liver hypomethylation status. T-DMRs located downstream from their transcription start sites also showed tissue-specific gene expression. These data indicate that multilayered regulation of tissue-specific gene function could be elucidated by DNA methylation tissue profiling.


Figures

Figure 1.
Figure 1.
DNA methylation profiles were analyzed by D-REAM. (A) Illustration of the D-REAM method. Genomic DNA was digested with methylation-sensitive restriction enzyme HpyCH4IV and amplified by modified LM-PCR (Supplemental Fig. S1). Amplified fragments (gray bars) were hybridized with mouse promoter tiling array (upper panel). Array signal intensities (vertical bars) were analyzed to identify regions corresponding to fragments in unmethylated HpyCH4IV loci. Comparison of signals from different samples enabled identification of differentially methylated regions (lower panel). HpyCH4IV loci overlapping with regions yielding differential signals were defined as T-DMRtags. (B) Agarose gel electrophoresis of undigested (lane 2), HpyCH4IV-digested (lane 3), and HpyCH4IV–TaqI-digested (lane 4) mouse liver DNA. Positions corresponding to 0.1, 0.5, 1.0, and 2.0 kbp (lanes 1,5) are indicated on one side of the gel image. (C) Venn diagram of DNA methylation status at HpyCH4IV sites in mouse liver and cerebrum. Numbers without parentheses represent numbers of HpyCH4IV sites, while Ensembl transcripts IDs are in parentheses. Outer and inner rectangles represent whole mouse genome and regions covered by the promoter tiling array, respectively. Ovals indicate unmethylated HpyCH4IV sites of liver and cerebrum identified by D-REAM. (D) Correlation of microarray probe intensities in duplicate mouse liver experiments, plotted on logarithmic axes (base 2). (E) MATscore distribution of array regions corresponding to the TaqI–TaqI fragments (gray) and HpyCH4IV-digested fragments (black). The dotted line represents the MATscore cutoff value. (F) Reliability of comparative MAT analysis. Bar-plots of MATscores of the hypomethylated regions identified by MAT (P < 10−3) using full .bpmap (Full) and subsets of .bpmap corresponding to HpyCH4IV fragments (Hpy) and TaqI–TaqI fragments (Taq). Shuffle column MATscores obtained by using both treatment and control samples containing both liver and cerebrum data from different mice. The boxes, and lines within the boxes, represent the interquartile ranges and medians of the ratios, respectively.
Figure 2.
Figure 2.
T-DMR positions depend on the genomic context. (A) Distribution of positions relative to TSS of hypomethylated T-DMRtags in liver. Upper and lower panels display distributions in non-CGI and CGI genes, respectively. The width of histogram units is 250 bp. CpG densities are indicated by blue lines. (B) Center of phastCons track regions in all CGI genes on chromosomes 5, 12, and 15 (obtained from UCSC genome browser database) plotted with a histogram unit width of 125 bp. (C) Positions of T-DMRtags on liver-specific non-CGI genes with HNF1 motifs with expression levels in liver >2-fold those in cerebrum, plotted with a 500-bp histogram category width. (D) T-DMRs neighboring the Gnmt genes analyzed by COBRA. Upper panel displays the position of HpyCH4IV, the regions of restriction mapping with the analyzed HpyCH4IV site, indicated by small arrowheads on the top, and positions of T-DMRs plotted over the comparative MATscores on IGB browser from 6000 bp upstream to 2500 bp downstream from the TSS. Middle panel shows CpG density (blue) and GC percentage (gray line) in this region. Bottom panels show agarose-gel electrophoresis images of COBRA. Hypomethylated fragments converted by bisulfite treatment were resistant to HpyCH4IV digestion (+). L and C indicate liver and cerebrum samples, respectively.
Figure 3.
Figure 3.
Genes with T-DMRtags (gray) in the complement and coagulation cascade in the modified KEGG pathway map (ID 04610) (A), and in the folate and methyl group metabolism pathway (Williams and Schalinske 2007) (B). (C) Transcription factor network for liver-specific gene expression. Arrows indicate that the gene expression is controlled by transcription factors. Dotted lines represent molecular interaction between factors.
Figure 4.
Figure 4.
Bisulfite sequencing of T-DMRs of liver-specific transcription factors, as Hnf1a (A), Hnf4a (B), Nr1h3 (C), Nr1i2 (D), and Rxra (E). Genomic structures are presented at the top of each figure section. The graphs in boxes toward the center in A and B represent CpG density (blue) and GC percentages (gray). The bars visible along the top of the center lines in A and B represent CpG dinucleotide positions; bars below represent HpyCH4IV sites. Boxes and arrowheads represent T-DMRs and T-DMRtags, respectively. IGB plots of comparative microarray signals corresponding to the regions in the abovementioned figures are displayed toward the bottom of the middle sections. Bisulfite sequencing data obtained for 10 isolates from liver (L) and cerebrum (C) are summarized at the bottom or side of the figure section. Open and closed circles represent unmethylated and methylated CpG, respectively.
Figure 5.
Figure 5.
The tissue-specific DNA methylation profiles and gene expression in mouse tissues. (A) Expression levels of human gene orthologs identified by the ChIP-Chip experiment using anti-HNF1 (closed rectangles) and of genes with HNF-1A motifs (model IDs T01211 and T00368) classified by the MAPPER database (open circles). (B) The distribution of expression levels of the genes listed in A, in cerebrum and liver represented by box plots. Expression levels were box-plotted with logarithmic scale (base = 10). (C) Box plots of log ratios (base = 2) of liver and cerebrum gene expression indicate factors affecting liver-specific expression of genes with T-DMRs. P-values obtained from Wilcoxon’s matched-pair signed rank test are indicated on the top of the plot. (D) Correlation of expression between two tissues. CGI genes containing T-DMRs are divided into two groups by the position of T-DMRs: T-DMRs within 0.5 to 2.5 kb downstream from the TSS (left panel) and those outside of this region (right panel). Gene expression levels and ratios of gene expression levels are expressed with logarithmic scale of base 10 and base 2, respectively. Numbers of liver-specific genes expressed, with expression levels <1000 in cerebral cortex and at a liver:cerebral cortex level ratio of >2, in the left and right panels are 60 out of 346 and 45 out of 685, respectively. (E) K-means clustering of regions corresponding to T-DMRs by Pearson’s correlations of their MATscores. The ranges of the MATscores represented in the plot are shown at the bottom of the panels. The MATscores were obtained by MAT analysis of D-REAM data from liver, kidney, and spleen using cerebrum data as the control. (F) χ2 test for distributions of genes, classified by the expression levels, first in kidney (>1000 or not) and those in the later set divided by their expression in liver (>2-fold of those in kidney or not), in each cluster. Statistically significant distributions are shadowed in pink.

References

    1. Barski A., Cuddapah S., Cui K., Roh T., Schones D., Wang Z., Wei G., Chepelev I., Zhao K. High-resolution profiling of histone methylations in the human genome. Cell. 2007;129:823–837. - PubMed
    1. Bird A. DNA methylation and the frequency of CpG in animal DNA. Nucleic Acids Res. 1980;8:1499–1504. - PMC - PubMed
    1. Bird A., Taggart M., Frommer M., Miller O., Macleod D. A fraction of the mouse genome that is derived from islands of nonmethylated, CpG-rich DNA. Cell. 1985;40:91–99. - PubMed
    1. Birney E., Andrews T., Bevan P., Caccamo M., Chen Y., Clarke L., Coates G., Cuff J., Curwen V., Cutts T., et al. An overview of Ensembl. Genome Res. 2004;14:925–928. - PMC - PubMed
    1. Bock C., Reither S., Mikeska T., Paulsen M., Walter J., Lengauer T. BiQ Analyzer: Visualization and quality control for DNA methylation data from bisulfite sequencing. Bioinformatics. 2005;21:4067–4068. - PubMed

Publication types