. 2009 Feb;37(2):366-74.
doi: 10.1124/dmd.108.024240. Epub 2008 Oct 29.

Regulation of hepatic cytochrome P450 expression in mice with intestinal or systemic infections of citrobacter rodentium

Affiliations

Regulation of hepatic cytochrome P450 expression in mice with intestinal or systemic infections of citrobacter rodentium

Madhusudana R Chaluvadi et al. Drug Metab Dispos. 2009 Feb.

Abstract

We reported previously that infection of C3H/HeOuJ (HeOu) mice with the murine intestinal pathogen Citrobacter rodentium caused a selective modulation of hepatic cytochrome P450 (P450) gene expression in the liver that was independent of the Toll-like receptor 4. However, HeOu mice are much more sensitive to the pathogenic effects of C. rodentium infection, and the P450 down-regulation was associated with significant morbidity in the animals. Here, we report that oral infection of C57BL/6 mice with C. rodentium, which produced only mild clinical signs and symptoms, produced very similar effects on hepatic P450 expression in this strain. As in HeOu mice, CYP4A mRNAs and proteins were among the most sensitive to down-regulation, whereas CYP4F18 was induced. CYP2D9 mRNA was also induced 8- to 9-fold in the C57BL/6 mice. The time course of P450 regulation followed that of colonic inflammation and bacterial colonization, peaking at 7 to 10 days after infection and returning to normal at 15 to 24 days as the infection resolved. These changes also correlated with the time course of significant elevations in the serum of the proinflammatory cytokines interleukin (IL)-6 and tumor necrosis factor-alpha, as well as of interferon-gamma and IL-2, with serum levels of IL-6 being markedly higher than those of the other cytokines. Intraperitoneal administration of C. rodentium produced a rapid down-regulation of P450 enzymes that was quantitatively and qualitatively different from that of oral infection, although CYP2D9 was induced in both models, suggesting that the effects of oral infection on the liver are not due to bacterial translocation.


Figures

F<sc>ig</sc>. 1.
Fig. 1.
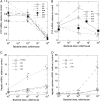
Serum cytokine profile during C. rodentium (Citro) infection in mice. Mice were infected with C. rodentium p.o., and blood was collected at sacrifice for measurement of serum cytokines as described under Materials and Methods. Values represent means ± S.E.M. of six mice per group, with the exception of the 15-day pair-fed group (five mice). *, P < 0.05 compared with pair-fed (PF) control. Differences between groups were determined by Student's t test.
F<sc>ig</sc>. 2.
Fig. 2.
Effect of oral C. rodentium (Citro) infection on CYP4A family mRNAs and proteins in mouse liver. Mice were infected with C. rodentium p.o., and livers were harvested at the indicated times for measurement of CYP4 mRNA and protein levels as described under Materials and Methods. A, CYP4F18 mRNA; B, CYP4A10, 4A14, and 4F15 mRNAs; C, CYP4 family proteins; D, Western blots from which the data in C were obtained. Values represent means ± S.E.M. of six mice per group, with the exception of the 15-day pair-fed (PF) group (five mice), and are calculated relative to the mean of the saline-injected control group, which was set at 1. *, P < 0.05 compared with untreated; #, P < 0.05 compared with pair-fed. Differences among groups were determined by one-way ANOVA followed by Tukey's test.
F<sc>ig</sc>. 3.
Fig. 3.
Effect of oral C. rodentium (Citro) infection on P450, cytokine, and acutephase protein mRNAs in mouse liver. Mice were infected with C. rodentium p.o., and livers were harvested at the indicated times for measurement of P450 mRNA levels as described under Materials and Methods. A, CYP2 family mRNAs; B, CYP1 and CYP3 family mRNAs; C, CYP2D9, cytokine and acute-phase mRNAs. Values represent means ± S.E.M. of six mice per group, with the exception of the 15-day pair-fed (PF) group (five mice), and are calculated relative to the mean of the saline-injected control group, which was set at 1. *, P < 0.05 compared with untreated; #, P < 0.05 compared with pair-fed. ^, not determined. Differences among groups were determined by one-way ANOVA followed by Tukey's test. AGP, α1-acid glycoprotein.
F<sc>ig</sc>. 4.
Fig. 4.
Effect of oral C. rodentium (Citro) infection on P450 family 2 and 3 proteins in mouse liver. Mice were infected with C. rodentium p.o., and livers were harvested at the indicated times for measurement of P450 protein levels by Western blotting as described under Materials and Methods. A, Western blots of samples from day 7 infected and control liver microsomes; B, quantitative analysis of the data in A. Values represent means ± S.E.M. of six mice per group, with the exception of the 15-day pair-fed (PF) group (five mice), and are calculated relative to the mean of the saline-injected control group, which was set at 1. *, P < 0.05 compared with untreated; #, P < 0.05 compared with pair-fed. Differences among groups were determined by one-way ANOVA followed by Tukey's test. AGT, angiotensinogen; FGA, fibrinogen α polypeptide; AGP, α1-acid glycoprotein.
F<sc>ig</sc>. 5.
Fig. 5.
Dependence on bacterial dose of parenteral infection of mice with C. rodentium on hepatic P450, cytokine, and acute-phase mRNAs. Mice received i.p. injections with the indicated number of C. rodentium cells and were killed 24 h later. Livers were harvested for measurement of liver mRNA levels by real-time RT-PCR. A, P450s 1A2, 2A5, 2B9, 2C29, 3A11, 3A25, and 3A41; B, P450s 2E1, 3A13, 4A10, 2D22, and 4A14; C, hepatic acute-phase protein mRNAs and CYP2D9; D, cytokine mRNAs. Values represent means ± S.E.M. of six mice per group and are calculated relative to the mean of the saline-injected control group, which was set at 1 for each mRNA. *, P < 0.05 compared with control. Differences between treated groups and control were determined by one-way ANOVA followed by Dunnett's test.
F<sc>ig</sc>. 6.
Fig. 6.
Effect of parenteral infection with C. rodentium on mouse hepatic P450 protein levels. Mice received i.p. injections of the indicated doses of C. rodentium and were killed 24 h later. Livers were harvested, and postmitochondrial supernatants were prepared for measurement of P450 protein levels by Western blot analyses. A, images of the Western blots. B, quantitative analysis of the Western blot data. Values represent means ± S.E.M. of six mice per group and are calculated relative to the mean of the saline-injected control group. *, P < 0.05 compared with control. Differences between treated groups and control were determined by one-way ANOVA followed by Dunnett's test.
F<sc>ig</sc>. 7.
Fig. 7.
Time courses of hepatic P450 and cytokine mRNA regulation after parenteral infection of mice with C. rodentium. Mice received i.p. injections of 108 cells of C. rodentium or with the same volume of sterile saline and were killed 6, 12, or 24 h later. A separate group of control animals was used for each time point. Livers were harvested for measurement of hepatic mRNA levels by real-time RT-PCR. A, P450 mRNAs; B, cytokine mRNAs. Values represent means ± S.E.M. of six mice per group and are calculated relative to the mean of the respective saline-injected control groups, which was set at 1 for each mRNA. *, P < 0.05 compared with control. Differences between treated groups and control were determined by Student's t test. Twenty-four-hour data are from the study in Fig. 5.
F<sc>ig</sc>. 8.
Fig. 8.
Comparison of hepatic P450 mRNA regulation during C. rodentium infection in HeOu and C57BL/6 mice. Data for C57BL/6 mice are from this study (Figs. 4 and 5), and data for HeOu mice are from Richardson et al. (2006). The levels of each P450 mRNA relative to pair-fed controls are shown. *, P < 0.05 compared with pair-fed.

References

    1. Aitken AE and Morgan ET (2007) Gene-specific effects of inflammatory cytokines on cytochrome P450 2C, 2B6, and 3A4 mRNA levels in human hepatocytes. Drug Metab Dispos 35 1687–1693. - PMC - PubMed
    1. Aitken AE, Richardson TA, and Morgan ET (2006) Regulation of drug-metabolizing enzymes and transporters in inflammation. Annu Rev Pharmacol Toxicol 46 123–149. - PubMed
    1. Beutler B, Du X, and Poltorak A (2001) Identification of Toll-like receptor 4 (Tlr4) as the sole conduit for LPS signal transduction: genetic and evolutionary studies. J Endotoxin Res 7 277–280. - PubMed
    1. Blume N, Leonard J, Xu ZJ, Watanabe O, Remotti H, and Fishman J (2000) Characterization of Cyp2d22, a novel cytochrome P450 expressed in mouse mammary cells. Arch Biochem Biophys 381 191–204. - PubMed
    1. Caradonna L, Amati L, Magrone T, Pellegrino NM, Jirillo E, and Caccavo D (2000) Enteric bacteria, lipopolysaccharides and related cytokines in inflammatory bowel disease: biological and clinical significance. J Endotoxin Res 6 205–214. - PubMed

Publication types

MeSH terms

Substances