Comparative Study
. 2008 Oct 29;28(44):11165-73.
doi: 10.1523/JNEUROSCI.3099-08.2008.

CNS learns stable, accurate, and efficient movements using a simple algorithm

Affiliations
Comparative Study

CNS learns stable, accurate, and efficient movements using a simple algorithm

David W Franklin et al. J Neurosci. .

Abstract

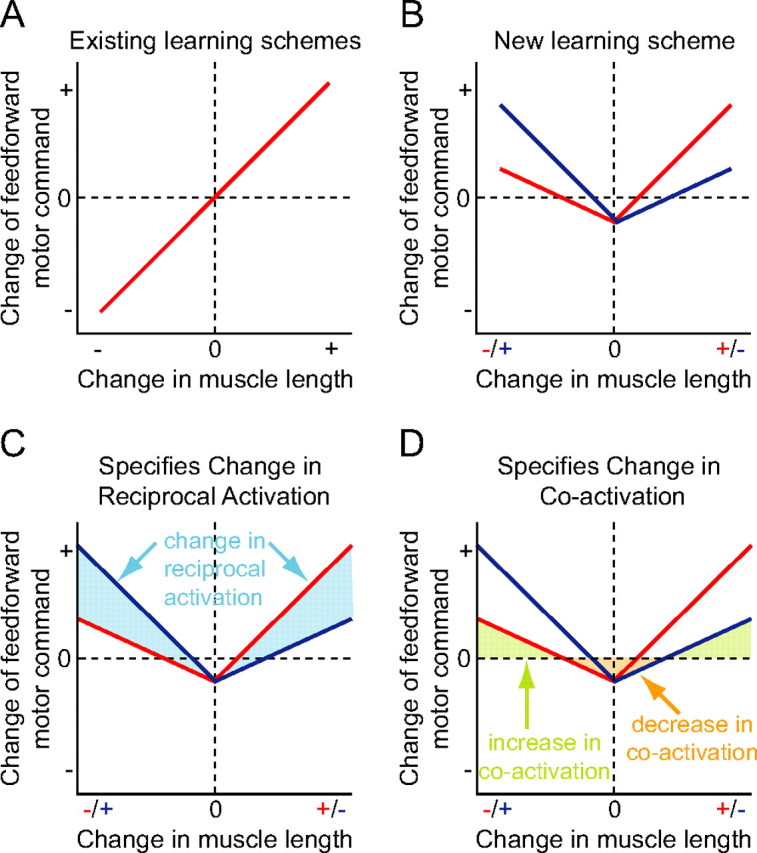
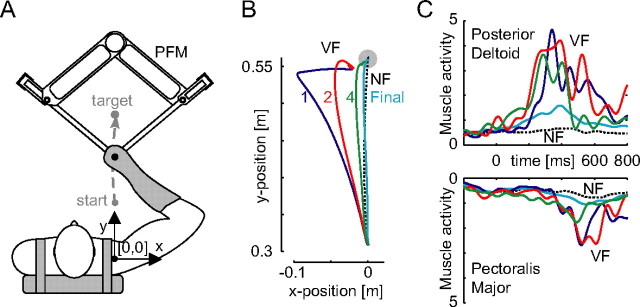
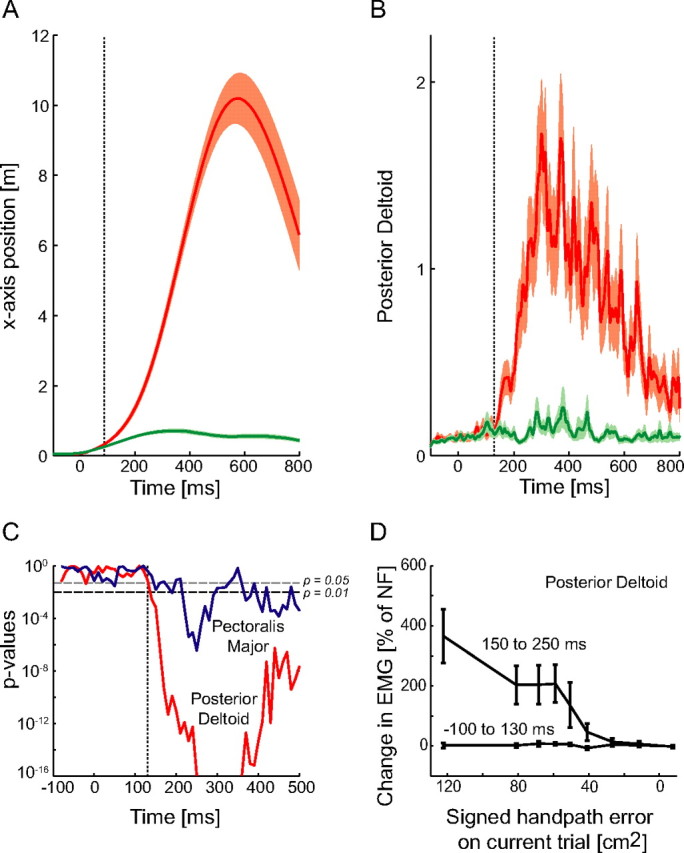
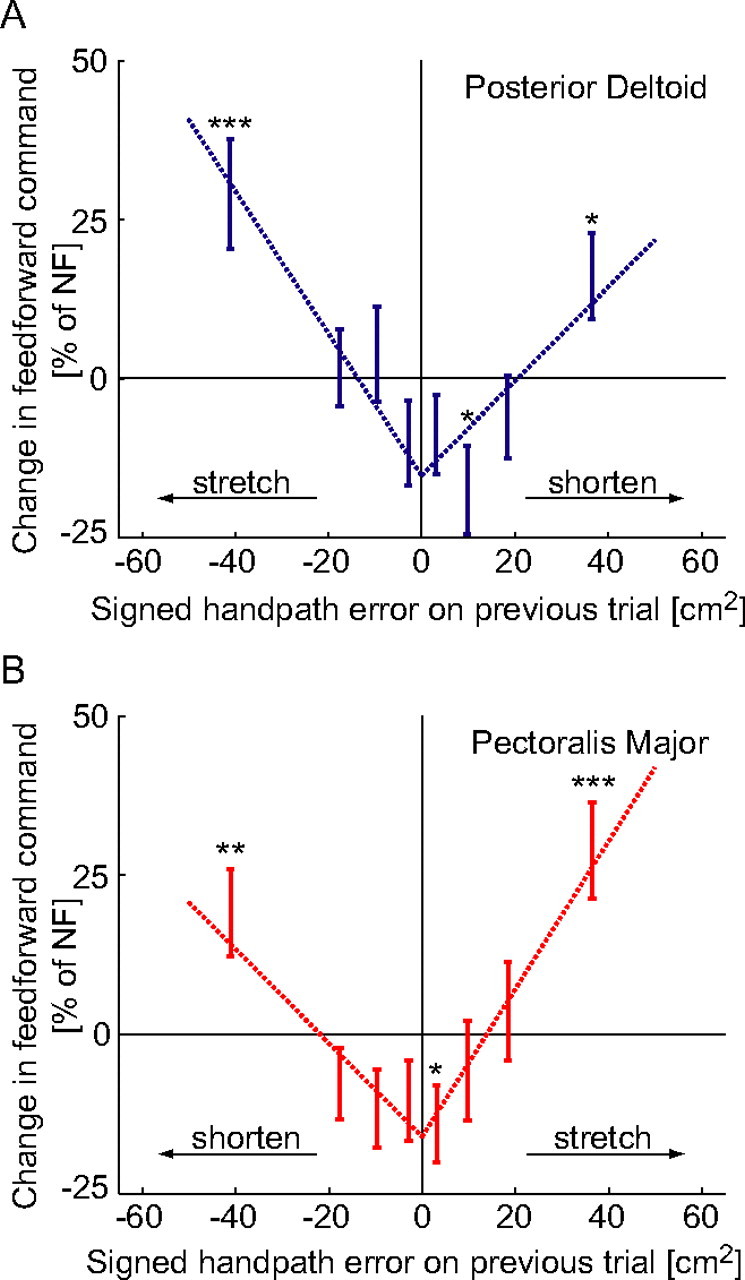
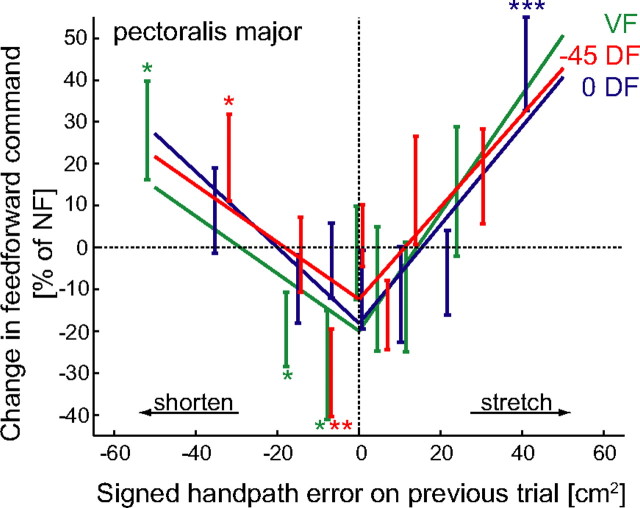
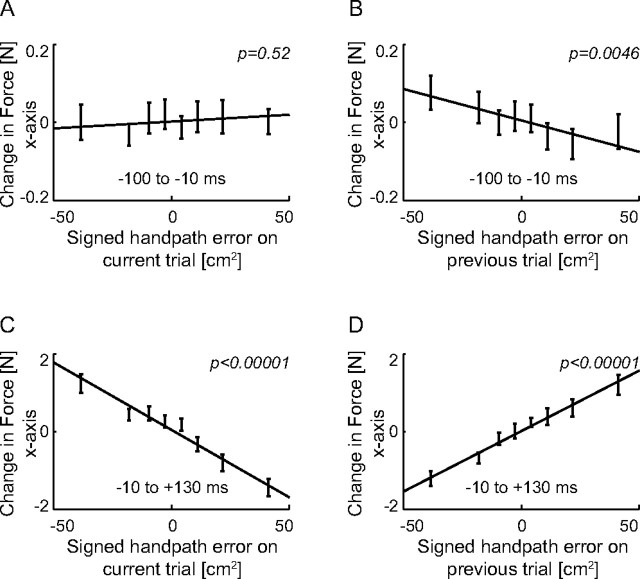
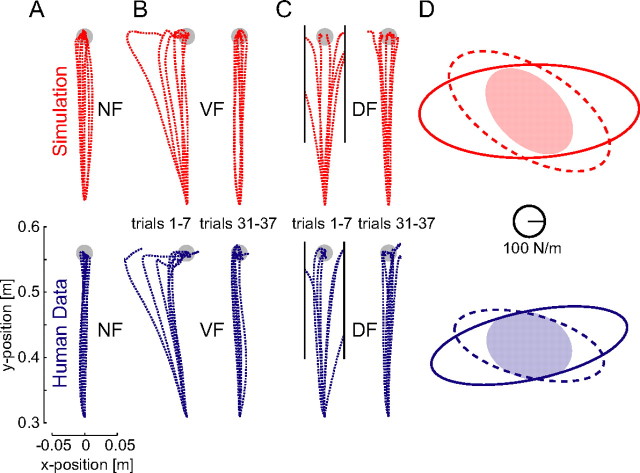
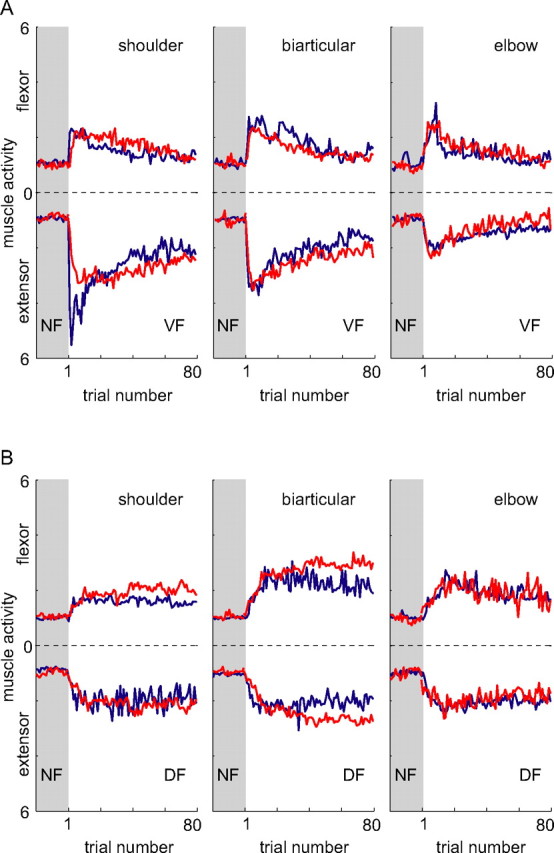
We propose a new model of motor learning to explain the exceptional dexterity and rapid adaptation to change, which characterize human motor control. It is based on the brain simultaneously optimizing stability, accuracy and efficiency. Formulated as a V-shaped learning function, it stipulates precisely how feedforward commands to individual muscles are adjusted based on error. Changes in muscle activation patterns recorded in experiments provide direct support for this control scheme. In simulated motor learning of novel environmental interactions, muscle activation, force and impedance evolved in a manner similar to humans, demonstrating its efficiency and plausibility. This model of motor learning offers new insights as to how the brain controls the complex musculoskeletal system and iteratively adjusts motor commands to improve motor skills with practice.


Figures

Figure 1.
Figure 1.
Comparison of models for motor learning. A, In previous motor learning schemes, update of the motor command (joint torque or muscle activation) corresponds to a monotonic antisymmetric (in most cases, linear) function of the joint angle error or muscle length error. B, In our new model there is a proportional increase in the feedforward command in response to muscle lengthening, a proportional increase in response to muscle shortening with a slightly lower gain, and a decrease when the error is near zero. This is shown for both muscles of an agonist–antagonist pair. C, When a disturbance occurs, this model produces a scaled response by modifying the reciprocal activation by the amount indicated in the shaded region to generate an opposing force. D, When a large disturbance occurs, this model will produce an increase in coactivation (green area) to stiffen the joint. When no disturbance is present, the motor command is reduced (orange area) to decrease metabolic cost.
Figure 2.
Figure 2.
Changes in posterior deltoid and pectoralis major muscle activity during learning of a novel skill. A, The PFM exerts forces on the hand during horizontal point-to-point reaching movements. B, Initial movements in the VF color coded by trial number (left). C, Hand trajectories (right) (mean of five subjects). The NF muscle activity is shown in black (solid: mean of 20 movements; dashed: SD). The activity in the first movement (blue) contains large feedback responses delayed ∼200 ms from the start of movement in the lengthened posterior deltoid and slightly later in pectoralis major, which is shortened. On the second movement (red), there is a large early increase in the activity of both muscles suggesting a feedforward pathway. This feedforward muscle activity is increased again by the fourth trial (green). As the feedforward command compensates for the external dynamics, there is a reduction of the muscle activity to a final level (cyan) (mean of the final 10 trials). Approximately 60 ms phase advance in muscle activity was observed only between the first and second trials, and this suggests that only the feedback component of the motor command is phase advanced by 60 ms and becomes a part of the feedforward command of the next trial. EMG signals from five subjects were rectified, averaged and then filtered (fifth-order Butterworth 10 Hz low pass) for display purposes.
Figure 3.
Figure 3.
Onset of feedback during perturbed trials. A, Position (x-axis) in the BE trials (red) compared with that in the NF trials (green) as a function of the time. Shaded regions represent the SEM of the position. The dotted line indicates the time at which the position in the BE trials was significantly (p < 0.05) different from that in the NF trial. Data is shown for one subject. B, Posterior deltoid muscle activity in the BE trials (red) compared with that in the NF trials (green). C, Muscle activity in BE trials was compared with that in NF movements. The p values of these comparisons are plotted on a log scale against time interval to determine the onset of the feedback response. No significant differences were seen before 130 ms (dotted vertical line) after movement onset. The horizontal line is located at p = 0.01. The earliest feedback responses occurred in the posterior deltoid muscle (shown). D, Responses in the posterior deltoid for two different time intervals (−100 to 130 ms) and (150–250 ms) relative to the onset of the movement. For each interval the integrated muscle activity was determined and grouped according to the signed handpath error. The mean values ± SEM are shown as a percentage increase in the muscle activity relative to the muscle activity in the NF movements for the same time interval. An ANOVA was used to compare differences with a main effect of signed handpath error and random effect of subjects. As expected, there was no significant difference in the muscle activity in the early interval (p = 0.28), i.e., before 130 ms after the onset of movement, whereas a clear response is seen in the later interval (p < 0.00001).
Figure 4.
Figure 4.
Changes in the feedforward components of the motor command. A, Change in feedforward activity of the posterior deltoid (mean ± SEM) plotted against the signed handpath error from the previous trial. The change in the feedforward activity was binned into equally sized groups depending on the signed handpath error and plotted against the mean signed handpath error of each group. *p < 0.05, **p < 0.01), ***p < 0.005, changes in feedforward activity significantly different from zero. B, Change in the feedforward activation of the pectoralis major. Both muscles showed similar responses: if the muscle either lengthened or shortened on the previous trial the feedforward command increased on the subsequent trial. However, if the signed handpath error was close to zero on the previous trial, then the feedforward command of both muscles was reduced. The dotted lines are the least squares linear fit to the positive and negative error regions of the data with a common intercept for both regions.
Figure 5.
Figure 5.
Changes in the feedforward components of the motor command for the pectoralis major muscle in each of the three force fields. The change in feedforward activity of the muscle (mean ± SEM) plotted against the signed handpath error from the previous trial. *p < 0.05), **p < 0.01), ***p < 0.005, changes in feedforward activity significantly different from zero. The solid lines are the least squares linear fit to the positive and negative error regions of the data with a common intercept for both regions.
Figure 6.
Figure 6.
Changes in endpoint force (x-axis) from one trial to the next as a function of the kinematic error. A, The change in force from the last trial to the current trial before the start of the movement expressed as a function of the signed handpath error on the current trial. The mean change in the force was determined from −100 to −10 ms relative to the onset of the movement. The p value indicates whether the slope of the linear regression is significantly different from zero. B, The trial-by-trial change in the force before the start of movement expressed as a function of the signed handpath error on the previous trial. The mean change in the force was determined from −100 to −10 ms relative to the onset of the movement. C, The trial-by-trial change in the force during an early time in the movement plotted as a function of the error on the current trial. The change in force was determined from −10 to 130 ms relative to the onset of movement. D, The trial-by-trial change in the force during an early time in the movement plotted as a function of the error on the previous trial. The change in force was determined from −10 to 130 ms relative to the onset of movement.
Figure 7.
Figure 7.
Simulation (red) shows that our new model adapts to both stable and unstable interactions and reproduces experimental data (blue). A, NF trajectories. B, Adaptation to the VF. C, Adaptation to the DF. D, Changes in endpoint stiffness after adaptation. Top, Stiffness ellipses in the NF (filled) and after adaptation to the VF (dashed) and DF (solid) estimated from simulated perturbations after completion of model learning. Bottom, Stiffness ellipses for the same conditions from experimental measurements on human subjects (mean of 6 subjects shown) (Franklin et al., 2003b).
Figure 8.
Figure 8.
Changes in integrated muscle activity as a function of trial number during learning. Results are shown for both the simulation (red) and the mean of five subjects (Franklin et al., 2003a) (blue). A, Learning in the VF. Movements were initially performed in the NF (shaded region). Once the force field was turned on, the muscle activity increased dramatically. As learning progressed, the activity leveled off and was gradually reduced to a steady state value. Similar trends in muscle activity are seen in the simulated and experimental data. Initially, coactivation is seen in all muscle pairs, but this is reduced and effectively eliminated by the end of learning, leaving significant activity only in the muscles producing shoulder extensor torque. B, Learning in the DF. Again similar patterns of changing muscle activation were seen in both the experimental and simulated data. In response to the initial perturbing effects of the force field, coactivation was seen in all muscle groups, with more occurring in the biarticular muscles. As learning progressed, muscle activation was reduced to a steady state value. Like the experimental data, the greatest steady-state activity was found in the biarticular muscles.

References

    1. Burdet E, Milner TE. Quantization of human motions and learning of accurate movements. Biol Cybern. 1998;78:307–318. - PubMed
    1. Burdet E, Codourey A, Rey L. Experimental evaluation of nonlinear adaptive controllers. IEEE Control Syst Mag. 1998;18:39–47.
    1. Burdet E, Osu R, Franklin DW, Yoshioka T, Milner TE, Kawato M. A method for measuring endpoint stiffness during multi-joint arm movements. J Biomech. 2000;33:1705–1709. - PubMed
    1. Burdet E, Osu R, Franklin DW, Milner TE, Kawato M. The central nervous system stabilizes unstable dynamics by learning optimal impedance. Nature. 2001;414:446–449. - PubMed
    1. Burdet E, Tee KP, Mareels I, Milner TE, Chew CM, Franklin DW, Osu R, Kawato M. Stability and motor adaptation in human arm movements. Biol Cybern. 2006;94:20–32. - PubMed

Publication types

LinkOut - more resources