. 2009 Jan 1;512(1):84-100.
doi: 10.1002/cne.21881.

Conservation and diversity of Foxp2 expression in muroid rodents: functional implications

Affiliations

Conservation and diversity of Foxp2 expression in muroid rodents: functional implications

Polly Campbell et al. J Comp Neurol. .

Abstract

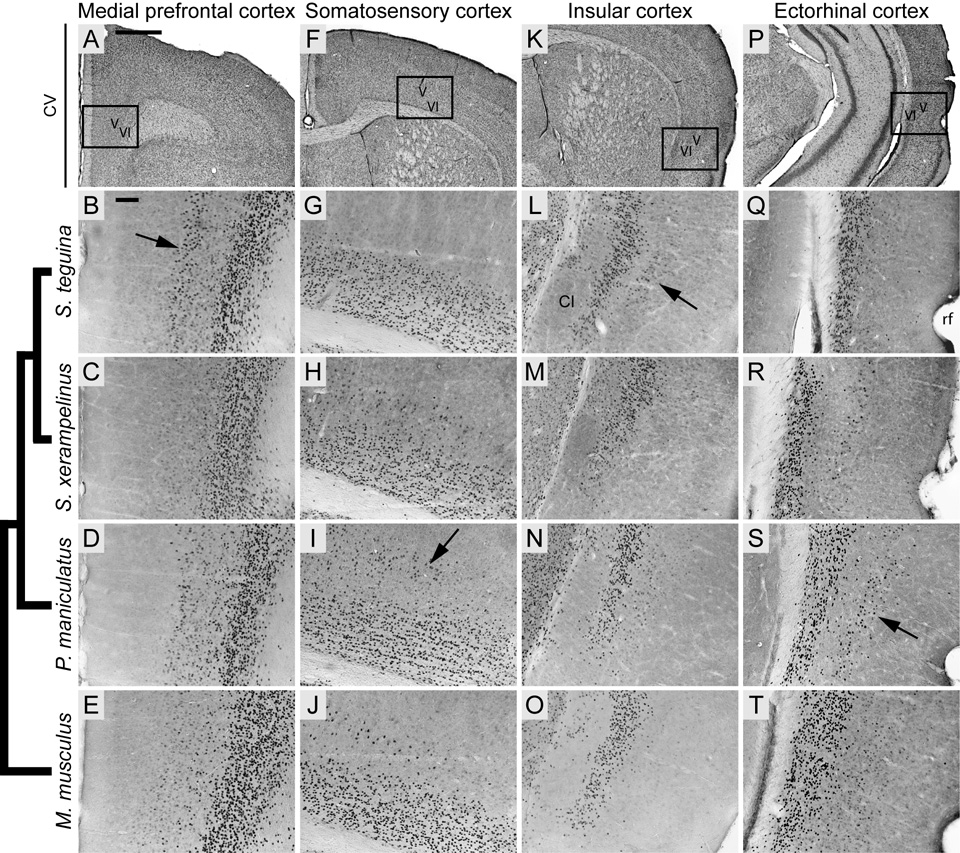
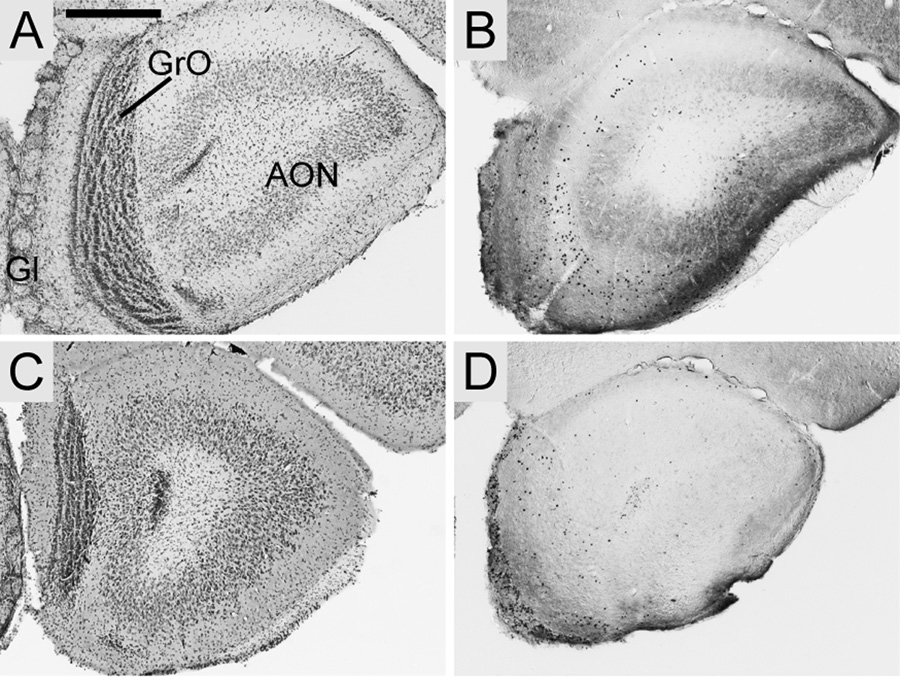
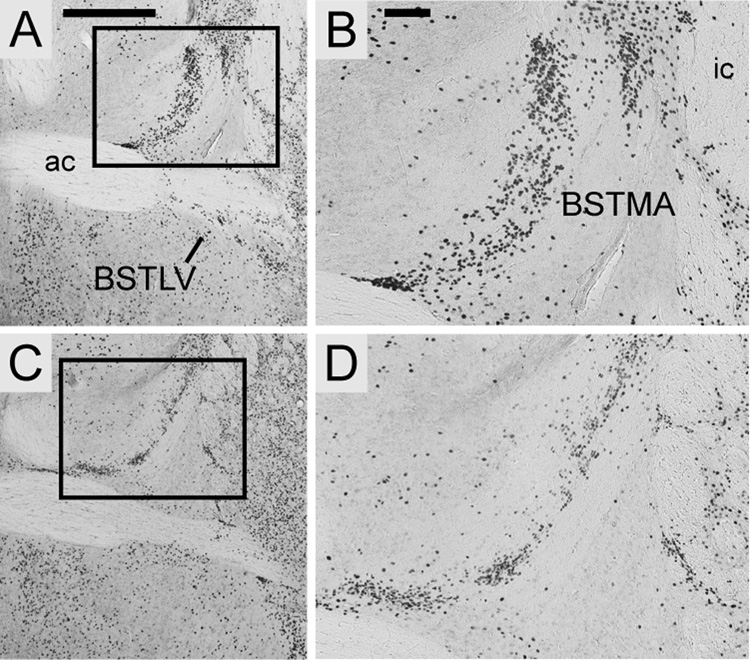
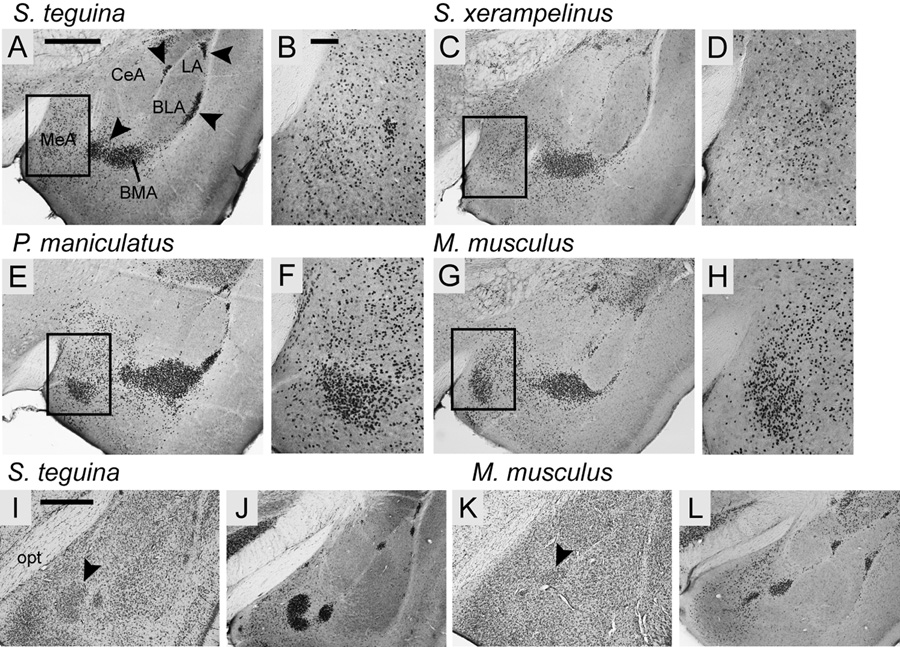
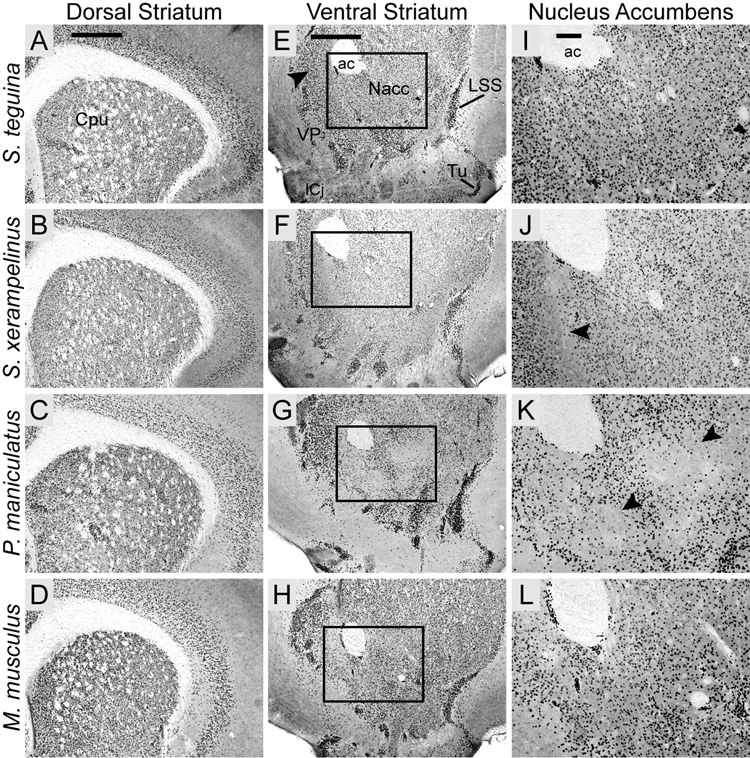
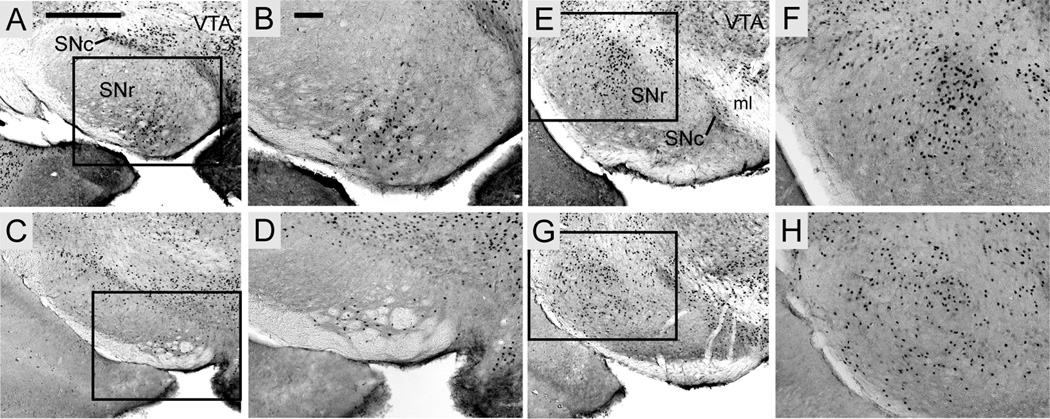
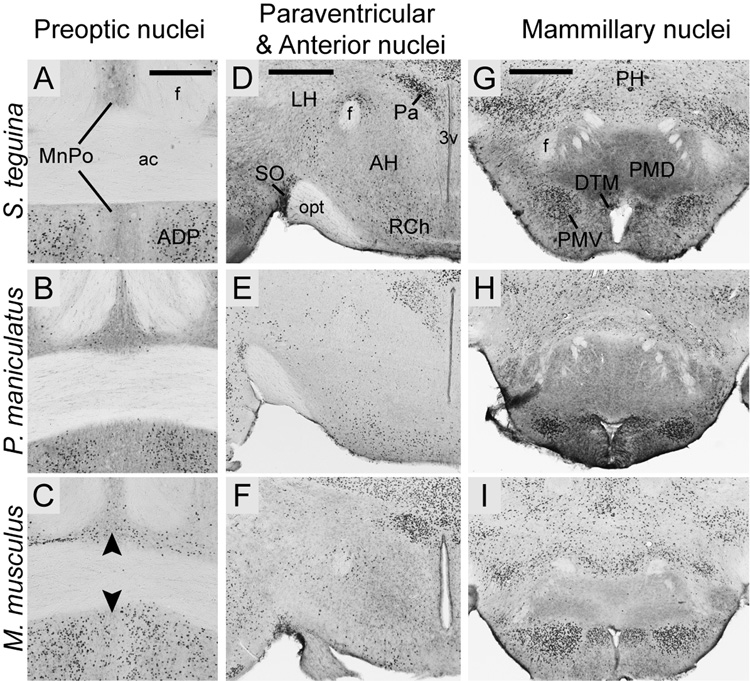
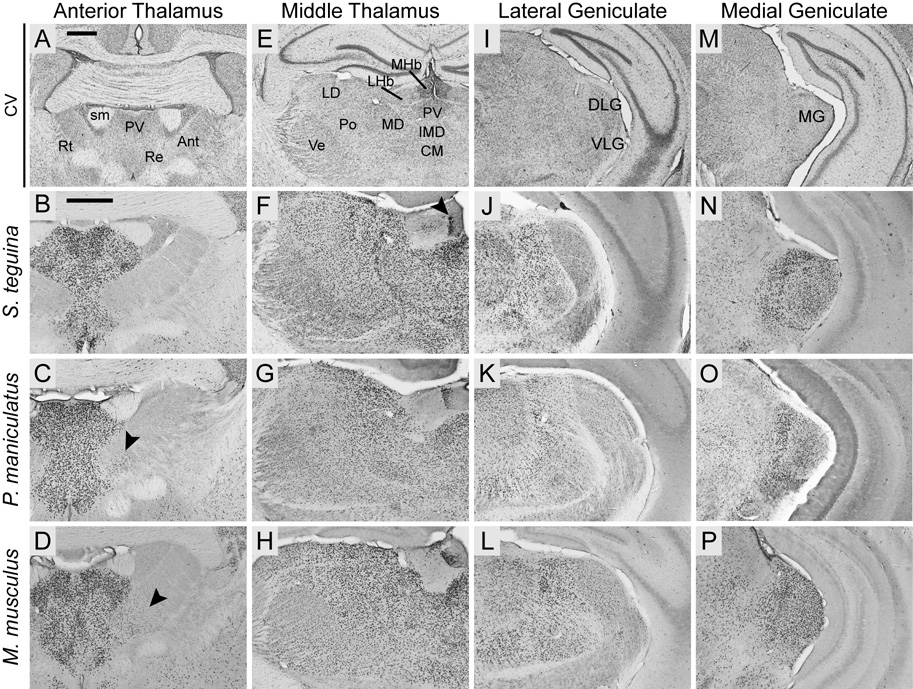
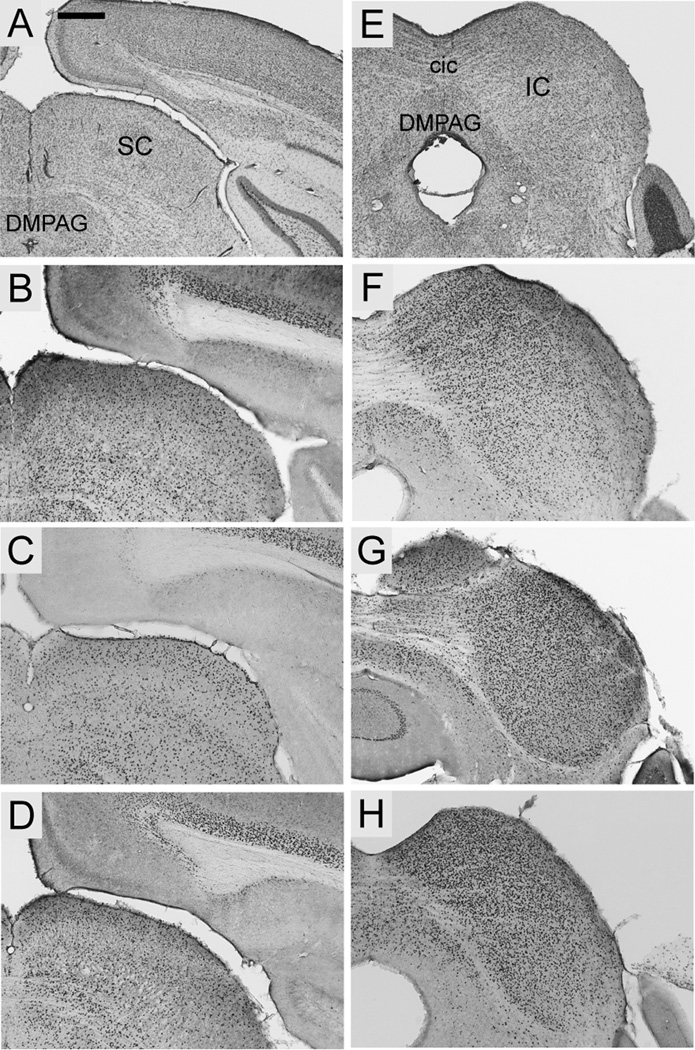
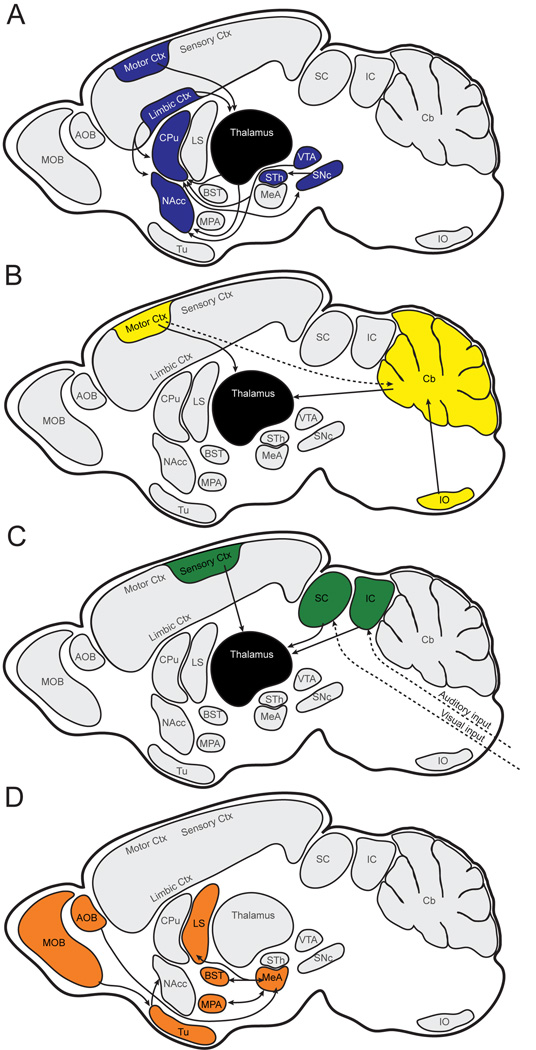
FOXP2, the first gene causally linked to a human language disorder, is implicated in song acquisition, production, and perception in oscine songbirds, the evolution of speech and language in hominids, and the evolution of echolocation in bats. Despite the evident relevance of Foxp2 to vertebrate acoustic communication, a comprehensive description of neural expression patterns is currently lacking in mammals. Here we use immunocytochemistry to systematically describe the neural distribution of Foxp2 protein in four species of muroid rodents: Scotinomys teguina and S. xerampelinus ("singing mice"), the deer mouse, Peromyscus maniculatus, and the lab mouse, Mus musculus. While expression patterns were generally highly conserved across brain regions, we identified subtle but consistent interspecific differences in Foxp2 distribution, most notably in the medial amygdala and nucleus accumbens, and in layer V cortex throughout the brain. Throughout the brain, Foxp2 was highly enriched in areas involved in modulation of fine motor output (striatum, mesolimbic dopamine circuit, olivocerebellar system) and in multimodal sensory processing and sensorimotor integration (thalamus, cortex). We propose a generalized model for Foxp2-modulated pathways in the adult brain including, but not limited to, fine motor production and auditory perception.


Figures

Fig. 1
Fig. 1
Cortical distribution of Foxp2 in four species of muroid rodents, showing high conservation in layer VI and variable expression in layer V. Phylogenetic relationships represented by cladogram on left after Steppan et al. (2004) and Reeder et al. (2006). A, F, K and P are coronal cresyl violet (CV) sections from S. teguina; boxed areas identify representative examples of Foxp2 expression from approximately the same levels in B–E, G–J, L–O and Q–T, respectively. B–E: Layer V Foxp2 expression in medial prefrontal cortex (ctx) is pronounced in S. teguina (arrow in B), lacking in S. xerampelinus and weak in P. maniculatus and M. musculus. G–J: Layer V Foxp2 expression in medial somatosensory ctx is lacking in S. teguina and most pronounced in P. maniculatus (arrow in I). L–O: Layer V Foxp2 expression in insular ctx at level of claustrum (CL) is pronounced in S. teguina (arrow in L), weak in S. xerampelinus and P. maniculatus and absent in M. musculus. Q–T: Layer V Foxp2 expression at ectorhinal/perirhinal ctx transition medial to the rhinal fissure (rf) is most pronounced in P. maniculatus (arrow in S). All sections are from adult males; females are indistinguishable from conspecific males. Scale bars = 500 µm in A (applies to A, F, K, P); 100 µm in B (applies to B–E, G–J, L–O, Q–T).
Fig. 2
Fig. 2
Foxp2 expression in the main olfactory bulb in coronal sections from S. teguina (A–B) and M. musculus (C–D). A and C are cresyl violet sections from each species; B and D are representative examples of Foxp2 expression from approximately the same level. Foxp2-enriched cells are present in the glomerular (Gl) and granular (GrO) cell layers, but not in the anterior olfactory nucleus (AON). Expression in S. teguina and M. musculus is representative of S. xerampelinus and P. maniculatus. Scale bar = 500 µm.
Fig. 3
Fig. 3
Localized Foxp2 expression in the bed nucleus of the stria terminalis, medial nucleus of the anterior division (BSTMA) and ventral nucleus of the lateral division (BSTLV). Expression in coronal sections from S. teguina (A–B) and M. musculus (C–D) is representative of S. xerampelinus and P. maniculatus. Boxed areas in A and C are magnified in B and D. Scale bars = 500 µm in A (applies to A, C); 100 µm in B (applies to B, D); ac, anterior commisure; ic, internal capsule.
Fig. 4
Fig. 4
The distribution of Foxp2 in the amygdala of four species of muroid rodents is conserved across nuclei but varies within the medial amygdala (MeA). A–H: In the anterior amygdala Foxp2 is mainly expressed in the MeA, basomedial (BMA) and the intercalated nuclei (arrowheads in A) of all four species, and is absent from the central (CeA), lateral (LA) and basolateral (BLA) nuclei. Boxed areas in A, C, E and G are magnified in B, D, F and H, showing a high concentration of Foxp2-positive cells in the ventral compartment of MeA in P. maniculatus (E–F) and M. musculus (G–H), but not in S. teguina (A–B) or S. xerampelinus (C–D). I–L: In the posterior amygdala Foxp2 is most concentrated in the intercalated nuclei. Arrowheads in cresyl violet sections for S. teguina (I) and M. musculus (K) identify the high density cell clusters in which Foxp2 is enriched. Differences between Foxp2 sections for S. teguina (J) and M. musculus (L) do not reflect species differences in expression; the representative section for S. teguina is slightly caudal to that for M. musculus. All sections are from adult males; females are indistinguishable from conspecific males. Scale bars = 500 µm in A (applies to A, C, E, G); 100 µm in B (applies to B, D, F, H); 500 µm in I (applies to I–L); opt, optic tract.
Fig. 5
Fig. 5
The striatal distribution of Foxp2 in four species of muroid rodents is conserved in the caudate putamen but exhibits subtle interspecific variation in the nucleus accumbens. A–D: All four species exhibit a characteristically heterogeneous pattern of Foxp2 expression throughout the caudate putamen (CPu). E–H: A similarly heterogeneous distribution is observed in the ventral striatum with local concentrations of Foxp2 expression in the dorsomedial shell of the nucleus accumbens (Nacc; arrow in E). Foxp2 is highly concentrated in the lateral stripe of the striatum (LSS), the islands of Calleja (ICj) and the olfactory tubercle (Tu), and in some areas in the anteromedial ventral pallidum (VP). Boxed areas are magnified in I–L, showing species differences in Foxp2 distribution in lateral nucleus accumbens. Uninterrupted expression in S. teguina (I) and M. Musculus (L) contrasts with areas of minimal expression, located ventromedial to the anterior commisure (ac) in S. xerampelinus (arrow in J) and ventrolateral to the ac in P. maniculatus (arrows in K). Scale bars = 500 µm in A (applies to A–D); 500 µm in E (applies to E–H); 100 µm in I (applies to I–L).
Fig. 6
Fig. 6
Foxp2 expression in the substantia nigra pars reticulata (SNr) is localized ventromedially in the anterior compartment (A–D) and dorsolaterally in the posterior compartment (E–H). Foxp2 distribution is continuous in the pars compacta (SNc). Expression in S. teguina (A–B, E–F) and M. musculus (C–D, G–H) is representative of S. xerampelinus and P. maniculatus. Boxed areas in A, C, E and G are magnified in B, D, F and H, respectively. Scale bars = 500 µm in A (applies to A, C, E, G); 500 µm in B (applies to B, D, F, H); VTA, ventral tegmental area; ml, medial lemniscus.
Fig. 7
Fig. 7
Foxp2 expression in selected hypothalamic nuclei in coronal sections from S. teguina, P. maniculatus and M. musculus. A–C: Expression in the midline median preoptic nucleus (MnPO) is pronounced in M. musculus (arrows in C) and minimal in P. maniculatus (B) and S. teguina (A). Expression in the anterodorsal nucleus (ADP) of the preoptic area is conserved across species. D–F: In all species, expression is concentrated in the paraventricular nuclei (Pa) and the supraoptic nucleus (SO), diffuse in the retrochiasmatic area (RCh) and absent from the anterior hypothalamic nuclei (AH). D–F: Foxp2 in mammillary nuclei, showing concentrated expression in dorsal tuberomammillary (DTM) and ventral premammillary (PMV) nuclei, and lack of expression in dorsal premammillary nucleus (PMD). Expression in S. teguina (A, D, G) is representative of S. xerampelinus. Scale bars = 300 µm in A (applies to A–C); 500 µm in D (applies to D–F); 500 µm in G (applies to G–I). f, fornix; ac, anterior commisure; 3V, third ventricle; opt, optic tract; PH, posterior hypothalamus.
Fig. 8
Fig. 8
Foxp2 is widely expressed throughout the thalamus in Scotinomys (represented by S. teguina), P. maniculatus and M. musculus. A, E, I andM are coronal cresyl violet (CV) sections from S. teguina from approximately the same levels as representative examples of Foxp2 expression in B–D, F–H, J–L and N–P, respectively. B–D: Foxp2 is concentrated in midline and intralaminar nuclei, including paraventricular (PV) and reuniens (Re), and absent from reticular nucleus (Rt). Expression in anterior nuclei (Ant) is observed only in the anteromedial nucleus in P. maniculatus (arrow in C) and M. musculus (arrow in D). F–H: Uninterrupted expression in PV, intermediodorsal (IMD), central medial (CM), mediodorsal (MD), posterior (Po), laterodorsal (LD) and ventral nuclei (Ve), strong localized expression in the medial habenular nucleus (MHb; arrow in F), and diffuse expression in the lateral nucleus (LHb). J–L: Expression in lateral geniculate is concentrated in dorsal (DLG) relative to ventral (VLG) nuclei. N–P: Foxp2 is highly enriched in medial geniculate (MG). Scale bars = 500 µm in A (applies to A, E, I, M); 500 µm in B (applies to B–D, F–H, J–L, N–P); sm, stria medullaris of thalamus.
Fig. 9
Fig. 9
Foxp2 expression in the collicular nuclei in coronal sections from S. teguina (B, F), P. maniculatus (C, G) and M. musculus (D, H). A and E are coronal cresyl violet sections from S. teguina from approximately the same levels as representative examples of Foxp2 expression in B–D and F–H, respectively. B–D: Foxp2 is expressed throughout the superior colliculus (SC). F–H: Expression is qualitatively more concentrated in inferior colliculus (IC). Expression in S. teguina is representative of S. xerampelinus. Scale bars = 16 500 µm in A (applies to A, E); 500 µm in B (applies to B–D, F–H); DMPAG, dorsomedial periaqueductal grey; cic, commisure of inferior colliculus.
Fig. 10
Fig. 10
Foxp2 expression in periaqueductal grey and selected raphe, parabrachial and tegmental nuclei in coronal sections from S. teguina (B, E) and M. musculus (C, F). A and D are cresyl violet sections from S. teguina from approximately the same levels as representative examples of Foxp2 expression in B–C and E–F, respectively. B–C: Periaqueductal grey expression is concentrated in dorsomedial (DMPAG) and dorsolateral (DLPAG) nuclei. In raphe nuclei expression is locally concentrated in dorsal nuclei (DR). E–F: Parabrachial, lemniscal and tegmental nuclei, showing expression in lateral (LPB) and medial parabrachial nuclei (MPB), dorsal nucleus of the lateral lemniscus (DLL) and dorsal (DTg), but not lateral (LTg) tegmental nuclei. Differences between S. teguina (E) and M. musculus (F) in parabrachial nuclei do not reflect species differences in expression; the representative section for S. teguina is slightly caudal to that for M. musculus. Expression in S. teguina and M. musculus is representative of S. xerampelinus and P. maniculatus. Scale bar = 500 µm; Su, supraoculomotor nuclei; On, oculomotor nucleus; scp, superior cerebellar peduncle; LL, lateral lemniscus.
Fig. 11
Fig. 11
Localized Foxp2 expression in cerebellum and hindbrain, shown in sagittal sections from S. teguina. A and C are cresyl violet; B and D are Foxp2. Boxed area in A indicates region magnified in B, showing localization of Foxp2 to the Purkinje cell layer (Pc) and the interposed nucleus (Int) in the cerebellum. In the hindbrain (C–D), Foxp2 is highly concentrated in the inferior olivary nuclei (IO), scattered in the prepositus nucleus (Pr) and absent from most other nuclei in the medulla, including the caudal part of the pontine reticular nucleus (PnC) and the nucleus of the solitary tract (Sol). Expression in S. teguina is representative of S. xerampelinus, P. maniculatus and M. musculus. Scale bars = 500 µm in A (applies to A, C, D); 100 µm in B; scp, superior cerebellar peduncle.
Fig. 12
Fig. 12
Schematic hypothesis for circuitry modulated by Foxp2 in the adult brain. A: Striatal modulation of fine motor response. B: Olivocerebellar modulation of motor timing. C: Thalamic integration of auditory and visual inputs. D: Limbic processing of olfactory input. Solid arrows indicate connectivity between regions in which Foxp2 expression is strong and continuous; broken arrows indicate pathways with discontinuous or weak expression. Connectivity between regions in which Foxp2 is not reciprocally expressed is not shown. AOB, accessory olfactory bulb; BST, bed nucleus of stria terminalis; Cb, cerebellum; CPu, caudate putamen; Ctx, cortex; IO, inferior olivary complex; LS, lateral septum; MeA, medial amygdala; MOB, main olfactory bulb; MPA, medial preoptic area; NAcc, nucleus accumbens; SNc, substantia nigra pars compacta; STh, subthalamic nucleus; Tu, olfactory tubercle; VTA, ventral tegmental area.

References

    1. Ackermann H, Graber S, Hertrich I, Daum I. Cerebellar contributions to the perception of temporal cues within the speech and nonspeech domain. Brain and Language. 1999;67:228–241. - PubMed
    1. Alcock KJ, Passingham RE, Watkins K, Vargha-Khadem F. Pitch and timing abilities in inherited speech and language impairment. Brain and Language. 2000;75:34–46. - PubMed
    1. Alloway KD, Lou L, Nwabueze-Ogbo F, Chakrabarti S. Topography of cortical projections to the dorsolateral neostriatum in rats: multiple overlapping sensorimotor pathways. Journal of Comparative Neurology. 2006;499:33–48. - PubMed
    1. Bayer SA. Neurogenetic patterns in the medial limbic cortex of the rat related to anatomical connections with the thalamus and striatum. Experimental Neurology. 1990;107:132–142. - PubMed
    1. Behbehani MM. Functional characteristics of the midbrain periaqueductal gray. Progress in Neurobiology. 1995;46:575–605. - PubMed

Publication types

Substances