. 2008 Nov 24;9(17):2860-71.
doi: 10.1002/cbic.200800467.

Hydrogen-bond detection, configuration assignment and rotamer correction of side-chain amides in large proteins by NMR spectroscopy through protium/deuterium isotope effects

Affiliations

Hydrogen-bond detection, configuration assignment and rotamer correction of side-chain amides in large proteins by NMR spectroscopy through protium/deuterium isotope effects

Aizhuo Liu et al. Chembiochem. .

Abstract

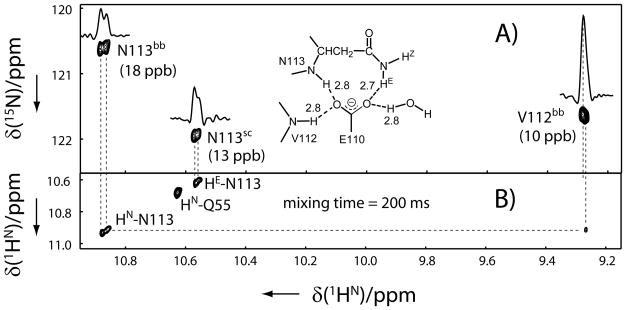
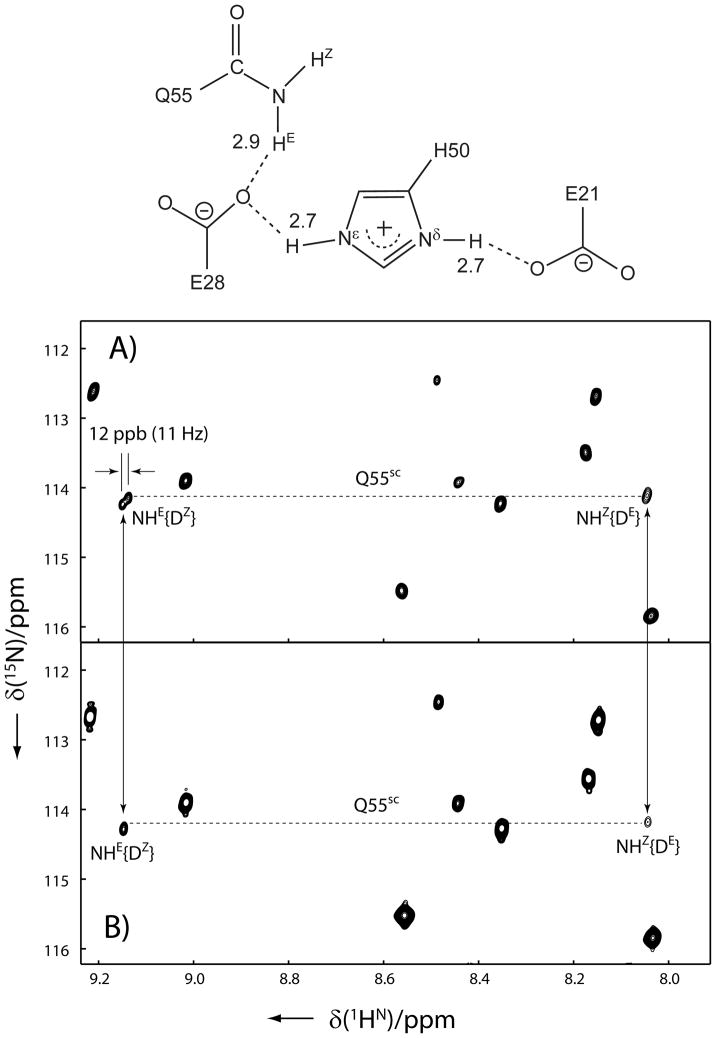
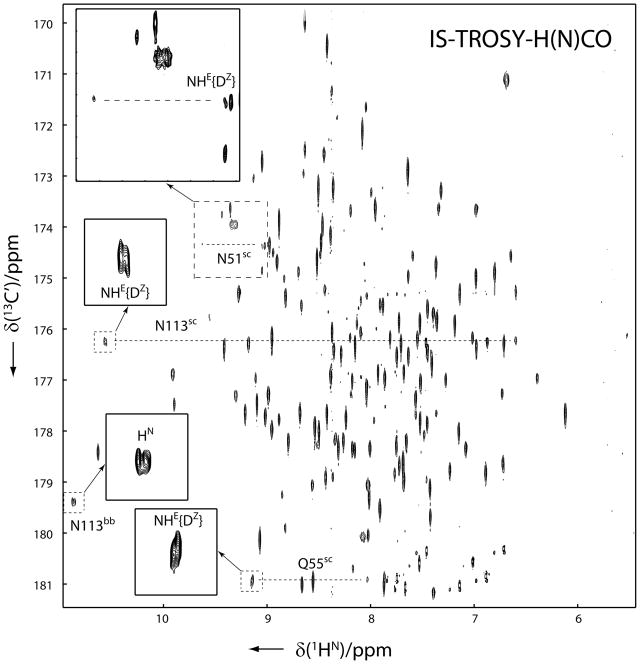
The configuration and hydrogen-bonding network of side-chain amides in a 35 kDa protein were determined by measuring differential and trans-hydrogen-bond H/D isotope effects by using the isotopomer-selective (IS)-TROSY technique, which leads to a reliable recognition and correction of erroneous rotamers that are frequently found in protein structures. First, the differential two-bond isotope effects on carbonyl (13)C' shifts, which are defined as Delta(2)Delta(13)C'(ND) = (2)Delta(13)C'(ND(E))-(2)Delta(13)C'(ND(Z)), provide a reliable means for the configuration assignment for side-chain amides, because environmental effects (hydrogen bonds and charges, etc.) are greatly attenuated over the two bonds that separate the carbon and hydrogen atoms, and the isotope effects fall into a narrow range of positive values. Second and more importantly, the significant variations in the differential one-bond isotope effects on (15)N chemical shifts, which are defined as Delta(1)Delta(15)N(D) = (1)Delta(15)N(D(E))-(1)Delta(15)N(D(Z)) can be correlated with hydrogen-bonding interactions, particularly those involving charged acceptors. The differential one-bond isotope effects are additive, with major contributions from intrinsic differential conjugative interactions between the E and Z configurations, H-bonding interactions, and charge effects. Furthermore, the pattern of trans-H-bond H/D isotope effects can be mapped onto more complicated hydrogen-bonding networks that involve bifurcated hydrogen-bonds. Third, the correlations between Delta(1)Delta(15)N(D) and hydrogen-bonding interactions afford an effective means for the correction of erroneous rotamer assignments of side-chain amides. Rotamer correction by differential isotope effects is not only robust, but also simple and can be applied to large proteins.


Figures

Figure 1
Figure 1
Regions of A) 2D 15N–1H IS-TROSY and B) 2D IS-TROSY-H(N)CO spectra of yCD showing Asn/Gln side-chain amide resonance correlations. On top of A) is a schematic diagram that illustrates how the differential H/D isotope effects on one-bond 15N chemical shifts, Δ1Δ15N(D) = 1Δ15N(DE) − 1Δ15N(DZ), are measured in the 2D 15N–1H IS-TROSY spectrum. Both spectra A) and B) were recorded on a Bruker AVANCE 900 MHz NMR spectrometer equipped with a TCI cryoprobe at 25 °C with a u-2H/13C/15N labeled protein sample in the 50% H2O/50% D2O solvent. The differential H/D isotope effects on one-bond 15N chemical shifts, Δ1Δ15N(D) = 1Δ15N(DE) − 1Δ15N(DZ) (modified by scalar couplings), and on two-bond 13C′ chemical shifts, Δ2Δ13C′ (ND) = 2Δ13C′ (NDE) − 2Δ13C′ (NDZ), where E stands for the trans and Z the cis side-chain amide hydrogen atoms, can be accurately measured from the chemical shift difference in the indirect dimension for the same carboxyamide moiety. Paired side-chain NH{D} resonances of each Asn/Gln residue is linked by two dash lines across the center of each resonance, and the chemical shift difference is indicated with paired arrows. Stereospecific distinction between the E and Z protons can be achieved based on the difference in isotope effects (refer to the text for details). Spectrum of A) was recorded with 8 scans and a 2 s delay time, t1max(15N) = 93 ms and t2max(1HN) = 285 ms, resulting in the experimental time of 2.4 h and spectrum of B) with 64 scans and a 1.8 s delay time, t1max(13C) = 110 ms and t2max(1HN) = 285 ms, resulting in the experimental time of 29.8 h Before Fourier transformation, the raw data were zero filled resulting in a 0.5 Hz digital resolution in the indirect dimension for spectrum A) and 1.0 Hz for B).
Figure 2
Figure 2
Regions of A) the 2D 15N–1H IS-TROSY spectrum and B) the 2D projection of 3D 15N–1H IS-TROSY-dispersed NOESY spectrum of yCD with u-2H/13C/15N labeling in 50% H2O/50% D2O. The spectrum was recorded on a Bruker AVANCE 900 MHz NMR spectrometer. Experimental and data processing conditions are the same as in Figure 1. Illustrated in the inset in panel A) is suggested hydrogen-bonding network of Asn113, which is derived from the 1.14 Ǻ crystal structure of yCD (accession code: 1P6O) after flipping the side-chain oxygen and nitrogen positions.
Figure 3
Figure 3
Regions of the 2D 15N–1H IS-TROSY spectra of u-2H/13C/15N labeled yCD in A) 50% H2O/50% D2O and B) 95% H2O/5% D2O. The spectra were recorded on a Bruker AVANCE 900 MHz NMR spectrometer. Experimental and data processing conditions are the same as in Figure 1. The doublets of Gln55-NHE{HZ} resonance are caused by across H-bond H/D isotope effects mediated via the bifurcated H-bond of His50-Hε/Dε as illustrated in the top diagram.
Figure 4
Figure 4
2D IS-TROSY-H(N)CO spectrum of u-2H/13C/15N labeled yCD in 50% H2O/50% D2O. The spectrum was recorded on a Bruker AVANCE 900 MHz NMR spectrometer. The doublet Asn/Gln side-chain amide cross-peaks, enclosed with dashed and enlarged with solid squares, are caused by trans-H-bond isotope effects 2hΔ1H and 4hΔ13C′. The spectrum was recorded with 128 scans and a 1.8 s delay time, t1max(13C) = 71 ms and t2max(1HN) = 285 ms, resulting in the experimental time of 41 h. Before Fourier transformation, the raw data were zero filled resulting in a 1.0 Hz digital resolution in the indirect dimension.
Figure 5
Figure 5
Evolution of the Cα RMSDs of residues 15–158 of subunit 1 (solid line) and subunit 2 (dashed line) from those of the 1.14 Ǻ-resolution crystal structure during the entire MD simulation period.
Figure 6
Figure 6
Variations of the torsion angles for the side-chain amides in the last 4-ns MD simulation. The torsion angles measured from the 1.14 Ǻ-resolution crystal structure are indicated by solid squares. The subunit identities are labeled at the top and residue identities on the left side.

Similar articles

Cited by

References

    1. Creighton TE. Proteins: Structure and Molecular Properties. 2. Freeman, W. H. and Company; New York: 1993.
    1. Word JM, Lovell SC, Richardson JS, Richardson DC. J Mol Biol. 1999;285:1735–1747. - PubMed
    1. Berman HM, Westbrook J, Feng Z, Gilliland G, Bhat TN, Weissig H, Shindyalov IN, Bourne PE. Nucleic Acids Res. 2000;28:235–242. - PMC - PubMed
    1. Weichenberger CX, Sippl MJ. Bioinformatics. 2006;22:1397–1398. - PubMed
    1. Hansen PE. Magn Reson Chem. 2000;38:1–10.

Publication types

LinkOut - more resources