. 2009 Aug;44(4):511-9.
doi: 10.1111/j.1600-0765.2008.01154.x. Epub 2009 Oct 7.

Factors affecting human supragingival biofilm composition. I. Plaque mass

Affiliations

Factors affecting human supragingival biofilm composition. I. Plaque mass

A D Haffajee et al. J Periodontal Res. 2009 Aug.

Abstract

Background and objective: Little is known about the factors that affect the microbial composition of supragingival biofilms. This study was designed to examine the relationship between total DNA probe counts of supragingival biofilm samples, clinical parameters and supragingival biofilm composition.

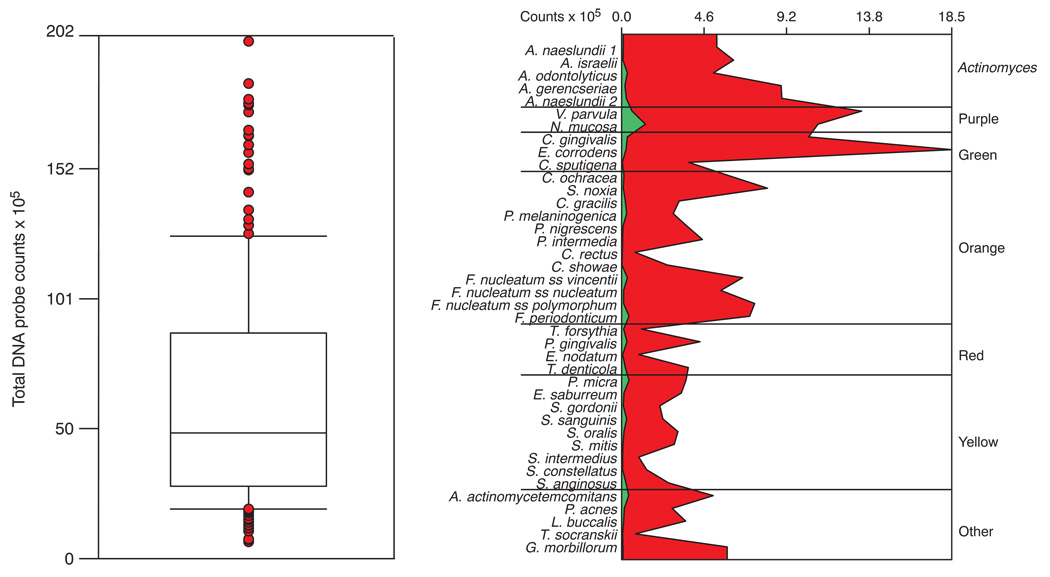
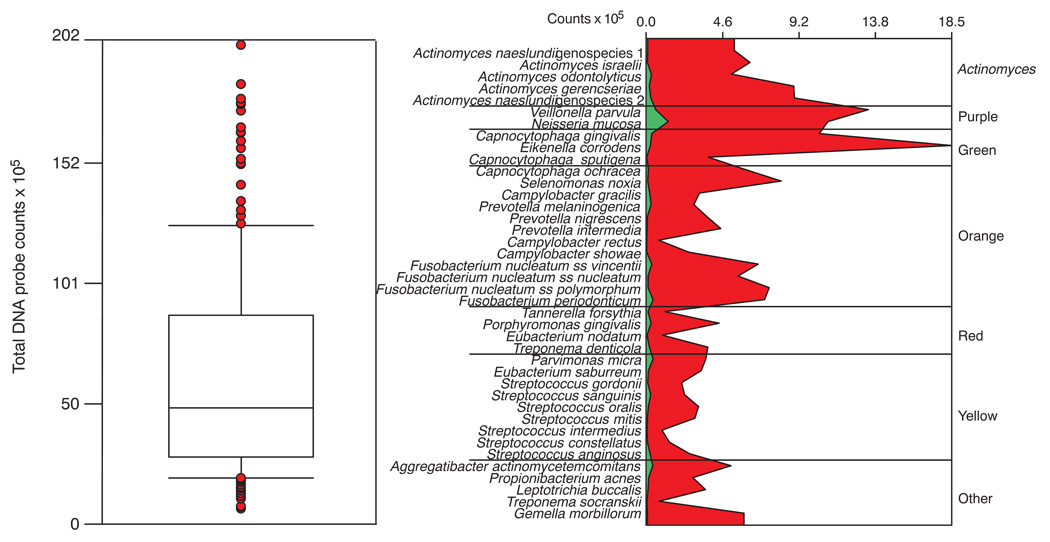
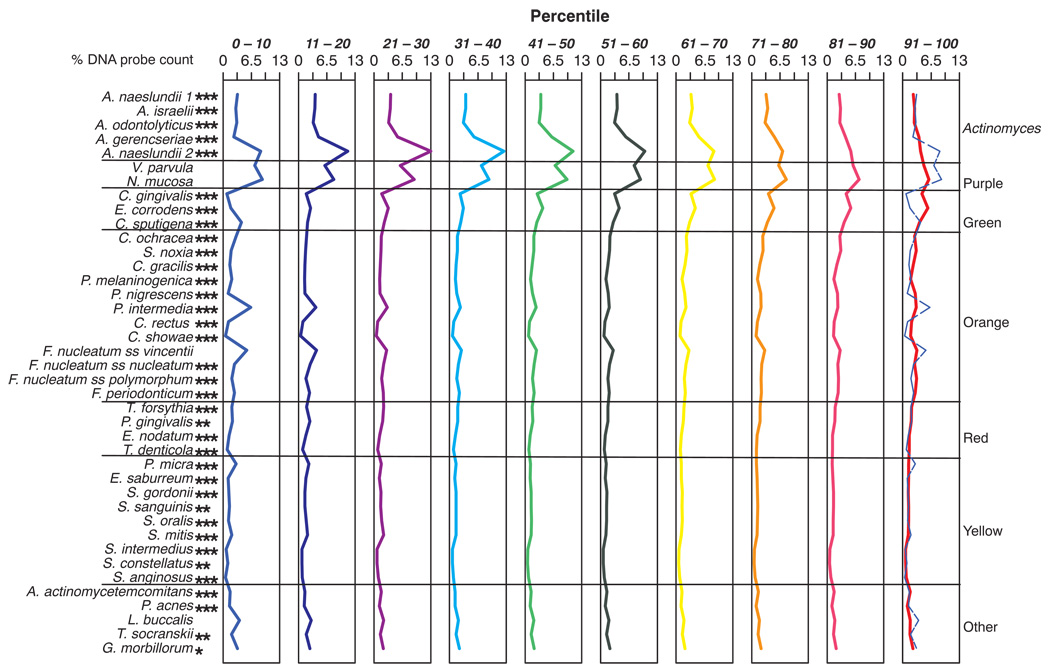
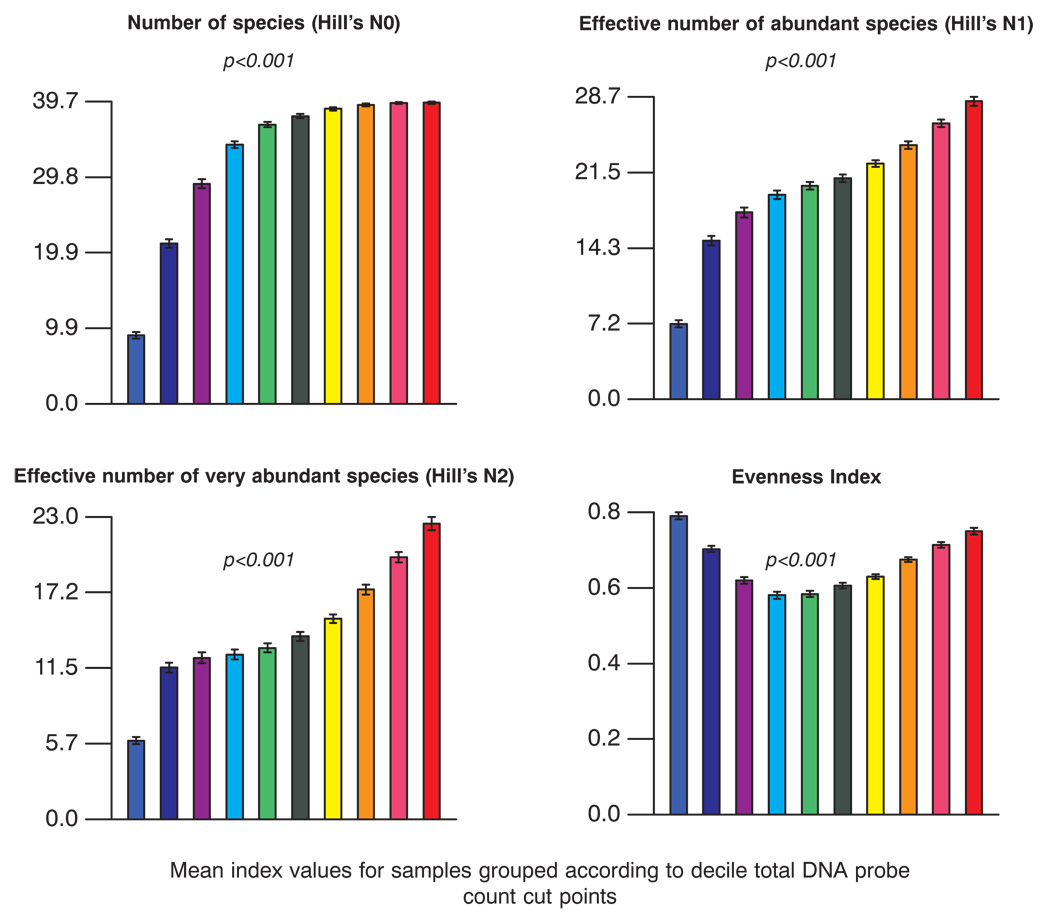
Material and methods: Supragingival plaque samples were taken from 187 systemically healthy adult subjects (n = 4745 samples). All samples were individually analyzed for their content of 40 bacterial species using checkerboard DNA-DNA hybridization. The relationship between total DNA probe counts and microbial composition was examined by subsetting the data into 10 groups based on 10 percentile increments of the total DNA probe counts. Differences among groups in terms of species counts and proportions were sought, as well as relationships of total plaque DNA probe count and clinical parameters.

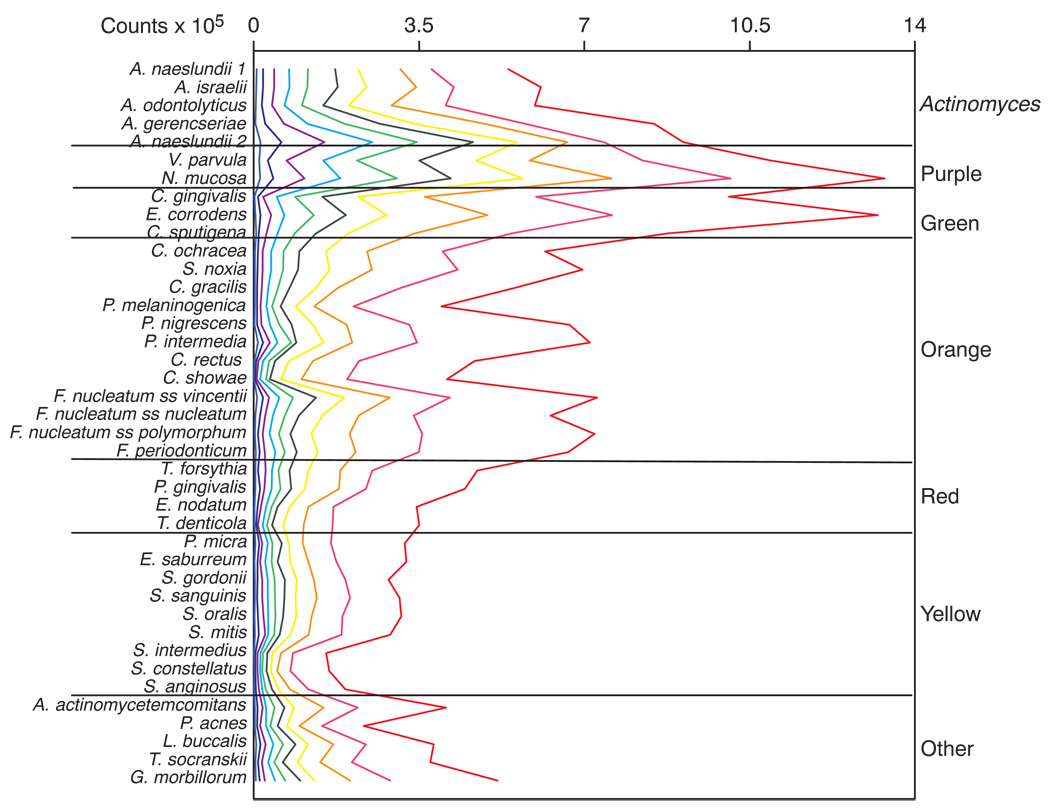
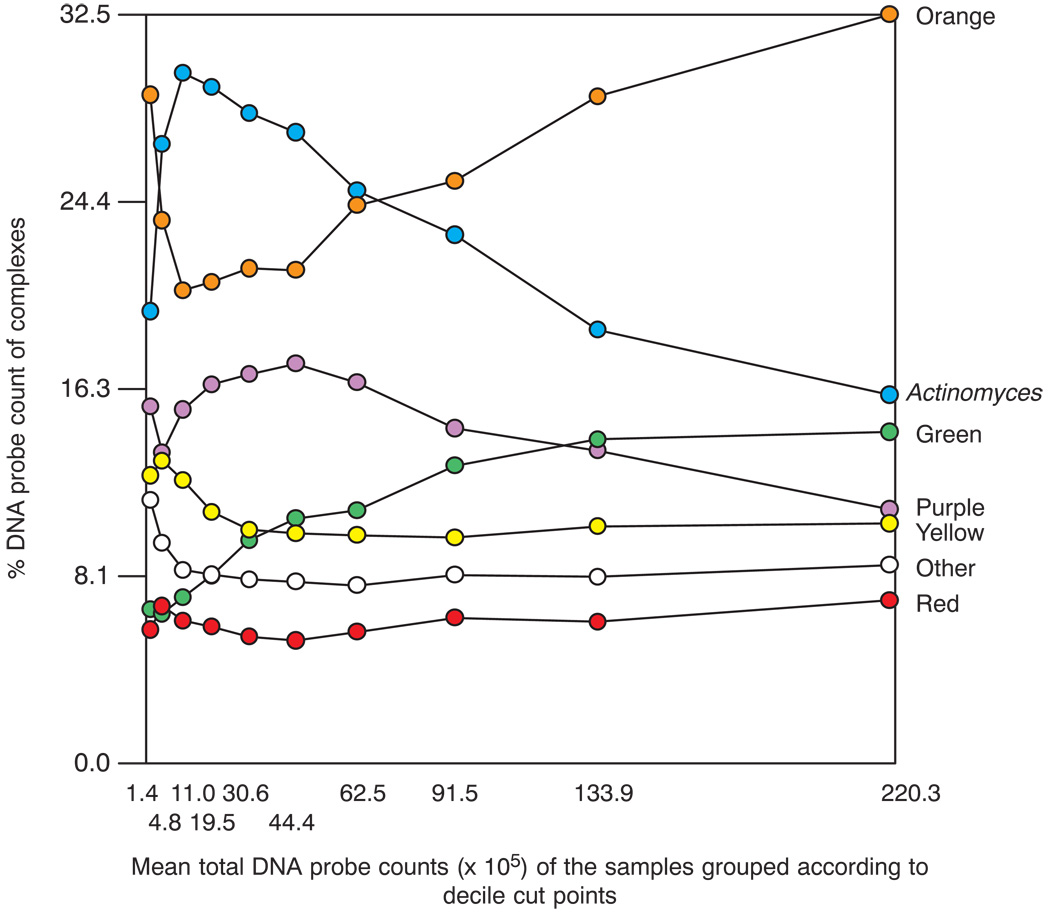
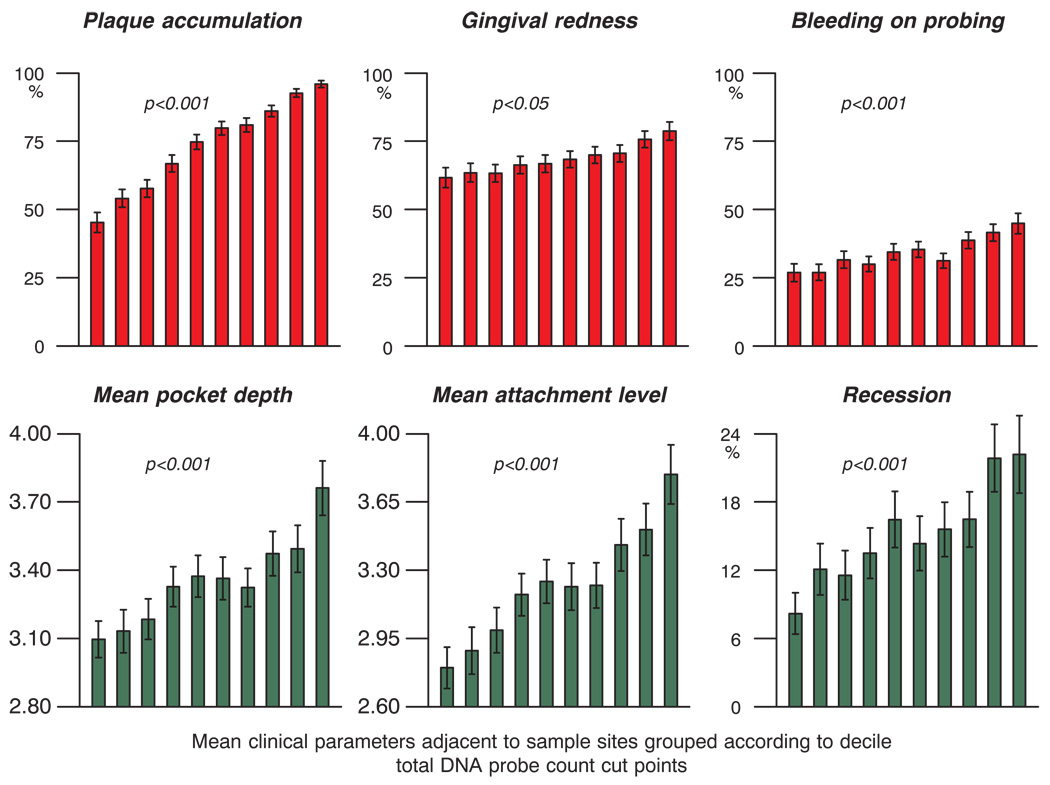
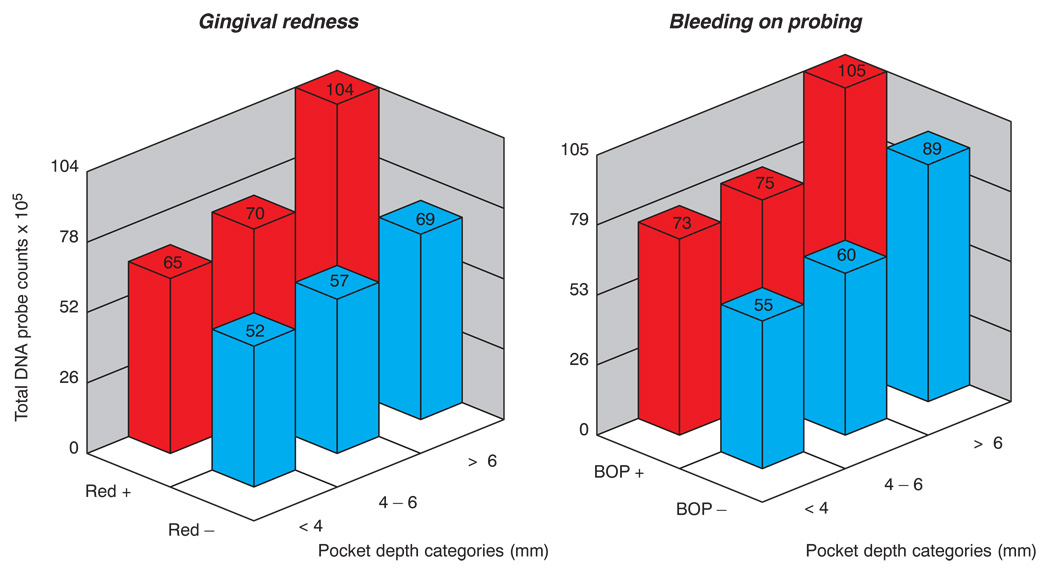
Results: There was a wide distribution in mean total DNA probe counts among the 187 subjects. With increasing total plaque levels there was a change in the proportions of individual species and microbial complexes. 'Small plaques' were characterized by high proportions of species in the yellow, orange, purple and 'other' complexes; plaques of moderate mass were characterized by high proportions of Actinomyces and purple complex species, while 'large plaques' exhibited increased proportions of green and orange complex species. Measures of gingival inflammation, pocket depth and recession were significantly positively associated with total DNA probe counts. Increased plaque numbers were related to increased pocket depth irrespective of presence or absence of gingival inflammation.

Conclusion: The proportions of individual species and microbial complexes in supragingival biofilms are influenced by the total numbers of organisms in the biofilm.


Figures

Fig. 1
Fig. 1
Tukey box plot demonstrating the distribution of the mean total DNA probe counts of supragingival biofilm samples for the 187 subjects (left panel). The box indicates the upper and lower quartile values, the horizontal line within the box represents the median value. The whiskers indicate the 10th and 90th percentiles and the circles present the values for individual subjects who were outside the 10th and 90th percentiles. The right panel presents the mean counts (× 105) of each of the 40 test species in the subject with the lowest mean total DNA probe counts (green panel) and the subject with the highest mean total DNA probe counts (red panel). Counts of individual species in samples from all teeth (excluding third molars) were averaged within each subject separately. The species are ordered according to supragingival microbial complexes (7).
Fig. 2
Fig. 2
Mean counts (× 105) of the 40 test bacterial species in supragingival biofilm samples taken from plaque with different total DNA probe counts. The samples were divided according to total DNA probe counts into 10 groups using the 10, 20, 30, 40, 50, 60, 70, 80, and 90th percentile of the total counts as cut points, providing an average of 475 supragingival plaque samples in each group. The counts were averaged within each decile group in each subject and then averaged across subjects for each decile group separately. The lines have been color-coded to represent the different groups; e.g. the lowest plaque mass group to the left of the plot is depicted in light blue, while the group with the largest plaque mass is depicted to the right of the plot in red. Significance of differences among groups for each of the test species was determined using the Kruskal Wallis test and adjusted for multiple comparisons (6). All species differed significantly among groups at p < 0.001.
Fig. 3
Fig. 3
Mean proportions of the 40 test bacterial species in supragingival biofilm samples taken from plaque with different total DNA probe counts. The samples were divided according to total DNA probe counts into 10 groups using the 10, 20, 30, 40, 50, 60, 70, 80, and 90th percentile of the total counts as cut points, providing an average of 475 supragingival plaque samples in each group. The proportions of each species were determined at each site, averaged within each decile group in each subject and then averaged across subjects for each decile group separately. The lines have been color-coded to represent the different groups; e.g. the lowest plaque mass group in the extreme left panel is depicted in light blue, while the group with the largest plaque mass is depicted in the extreme right panel in red. The dashed blue line in this panel represents the profile of the lowest plaque mass group in the first panel. Significance of differences among groups for each of the test species was determined using the Kruskal Wallis test and adjusted for multiple comparisons; * p < 0.05; ** p < 0.01; *** p < 0.001.
Fig. 4
Fig. 4
Plot of the total of the mean proportions comprised by the 7 supragingival complexes described by Haffajee et al. (7) in the 10 total DNA probe count groups presented in Fig. 2. The x-axis values represent the mean values for each group and the y-axis represents the sum of the proportions comprised by the species in each microbial complex.
Fig. 5
Fig. 5
Bar plots of diversity indices for each of the 10 total DNA probe count groups described in Fig. 2. These included the number of species (Hill’s N0), number of abundant (Hill’s N1) and very abundant species (Hill’s N2) and the evenness index (5). The bars represent the decile groups and are color coded as depicted in Fig. 2.
Fig. 6
Fig. 6
Mean clinical parameters (± SEM) at sites subset according to the 10 total DNA probe count categories described in Fig. 2. The clinical parameters were averaged within each total DNA probe count decile group in each subject and then averaged across subjects for each decile group separately. Significance of differences among percentile groups based on total DNA probe counts was determined for each clinical parameter using the Kruskal Wallis test.
Fig. 7
Fig. 7
Bar charts of the mean total DNA probe counts at sites subset according to pocket depth categories < 4, 4–6 and > 6 mm and presence or absence of gingival redness (left panel) or bleeding on probing (right panel). 2-way ANOVA indicated that total DNA probe counts differed significantly among pocket depth categories and also between presence or absence of gingival redness, or between presence or absence of bleeding on probing.
Fig. 8
Fig. 8

References

    1. Sharawy AM, Sabharwal K, Socransky SS, Lobene RR. A quantitative study of plaque and calculus formation in normal and periodontally involved mouths. J Periodontol. 1966;37:495–501. - PubMed
    1. Zee KY, Samaranayake LP, Attstrom R. Predominant cultivable supragingival plaque in Chinese “rapid” and “slow” plaque formers. J Clin Periodontol. 1996;23:1025–1031. - PubMed
    1. Socransky SS, Smith C, Martin L, Paster BJ, Dewhirst FE, Levin AE. “Checkerboard” DNA-DNA hybridization. Biotechniques. 1994;17:788–792. - PubMed
    1. Socransky SS, Haffajee AD, Smith C, Martin L, Haffajee JA, Uzel NG, et al. The use of checkerboard DNA-DNA hybridization to study complex microbial ecosystems. Oral Microbiol Immunol. 2004;19:352–362. - PubMed
    1. Ludwig JA, Reynolds JF. A primer on methods and computing. New York: Wiley; 1988. Statistical ecology; pp. 89–95.

Publication types

MeSH terms