. 2008 Oct 30:8:70.
doi: 10.1186/1471-2288-8-70.

Reducing bias through directed acyclic graphs

Affiliations

Reducing bias through directed acyclic graphs

Ian Shrier et al. BMC Med Res Methodol. .

Abstract

Background: The objective of most biomedical research is to determine an unbiased estimate of effect for an exposure on an outcome, i.e. to make causal inferences about the exposure. Recent developments in epidemiology have shown that traditional methods of identifying confounding and adjusting for confounding may be inadequate.

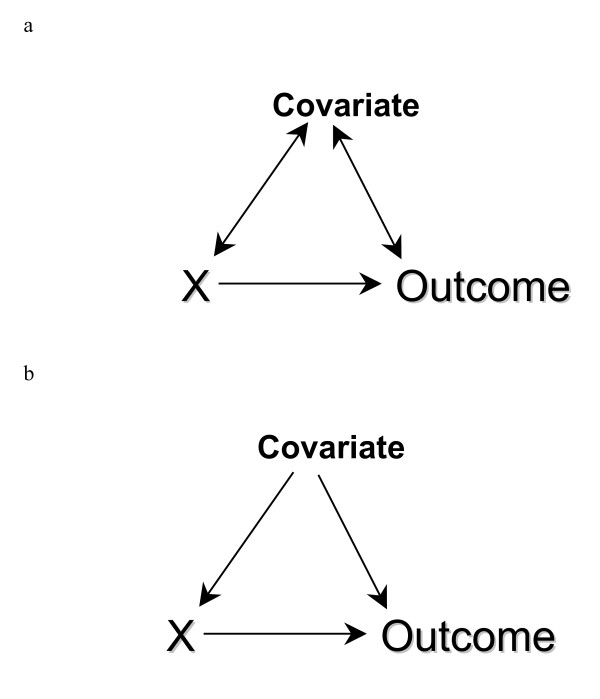
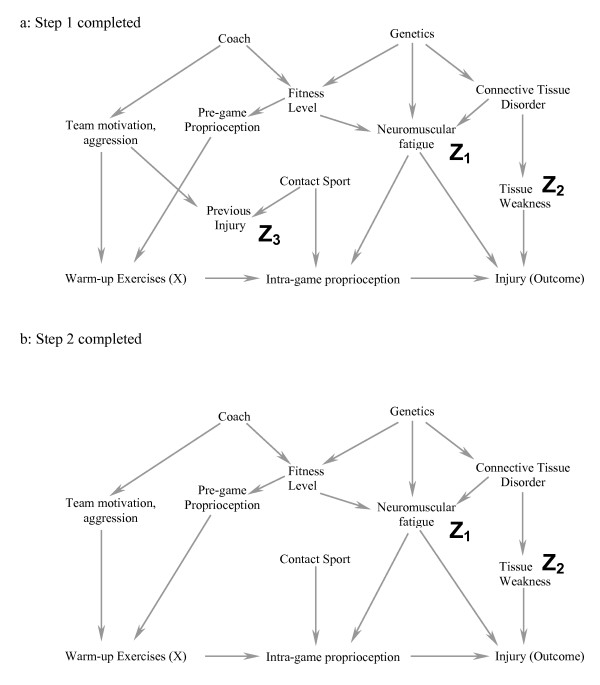
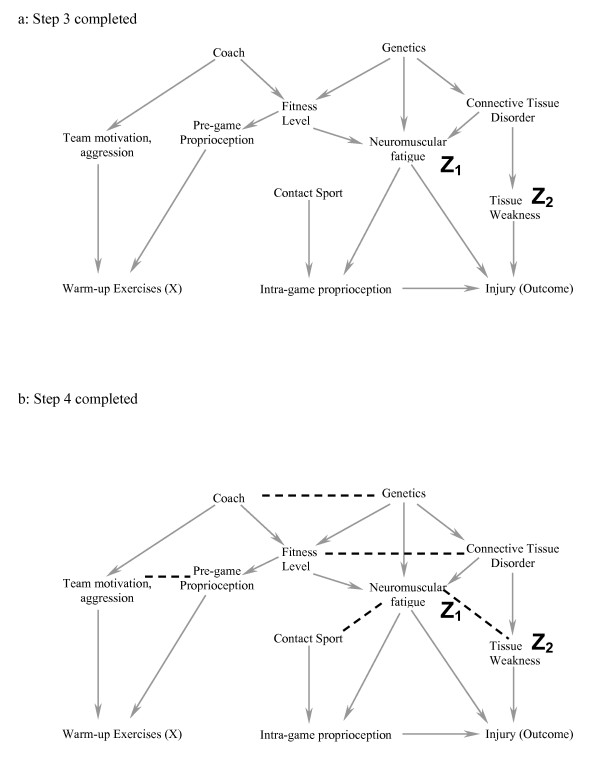
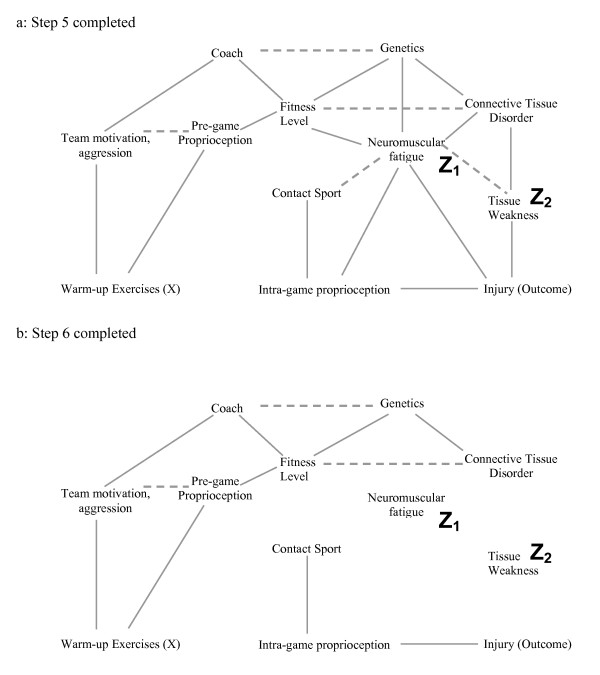
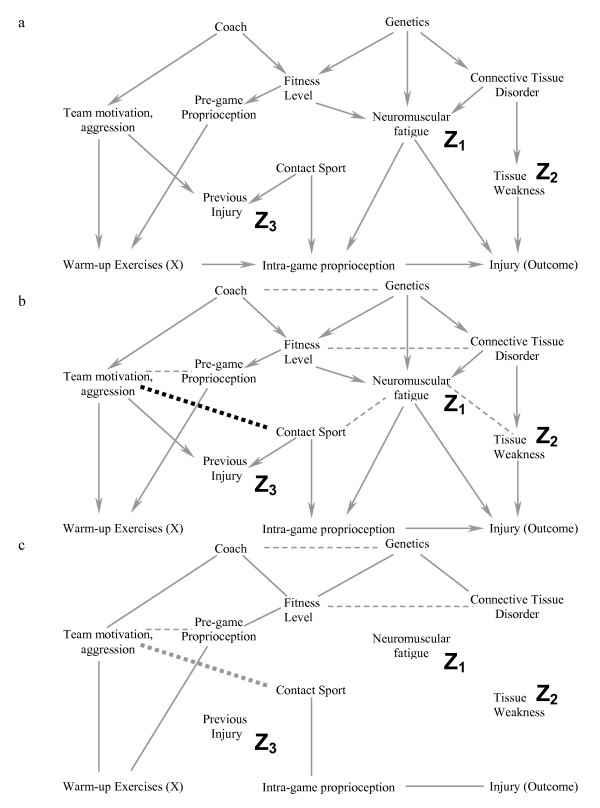
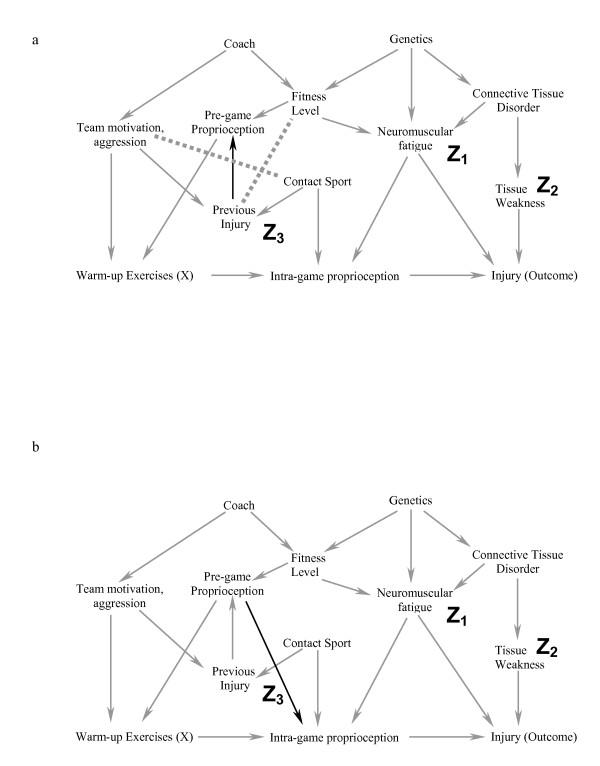
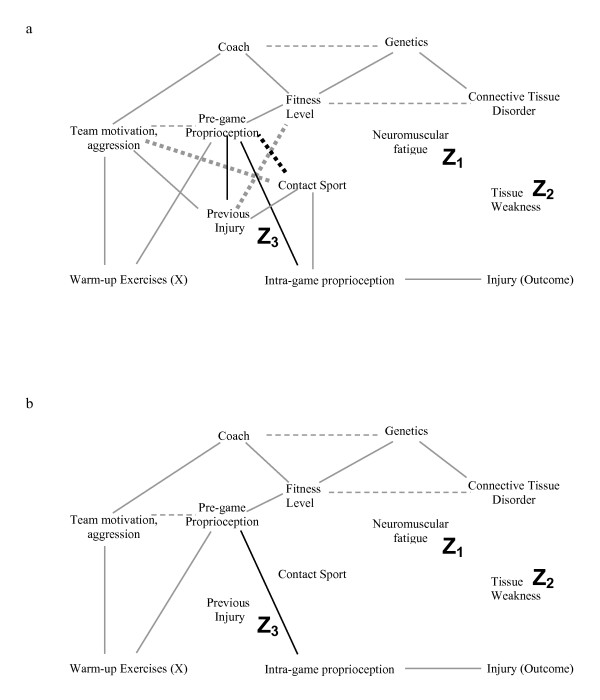
Discussion: The traditional methods of adjusting for "potential confounders" may introduce conditional associations and bias rather than minimize it. Although previous published articles have discussed the role of the causal directed acyclic graph approach (DAGs) with respect to confounding, many clinical problems require complicated DAGs and therefore investigators may continue to use traditional practices because they do not have the tools necessary to properly use the DAG approach. The purpose of this manuscript is to demonstrate a simple 6-step approach to the use of DAGs, and also to explain why the method works from a conceptual point of view.

Summary: Using the simple 6-step DAG approach to confounding and selection bias discussed is likely to reduce the degree of bias for the effect estimate in the chosen statistical model.


Figures

Figure 1
Figure 1
The bi-directional arrows in A show the traditional representation of a confounder as being associated with the exposure (X) and outcome. Because confounders must cause (or be a marker for a cause) of both exposure and outcome (see text for rationale based on basic principles), directed acyclic graphs use only unidirectional arrows to show the direction of causation (B).
Figure 2
Figure 2
a-b. Diagrammatic equivalent of the 6-step process to determine if one obtains an unbiased estimate of the exposure of interest (X) on the Outcome by including a particular subset of covariates (see text for details of the specific steps). In this example, we are interested in minimizing the bias when estimating the causal effect of warming up on the risk of injury. In figure 2a, a possible causal diagram of variables that are associated with warming up (X) and injury (outcome) are shown. The main mediating variable is believed to be proprioception (balance and muscle-contraction coordination) during the game. Starting at the top of the figure, the coach affects the team motivation (including aggressiveness), which affects both the probability of previous injury and the player's compliance with warm-up exercises. A player's genetics affects their fitness level (along with the coach's fitness program) and whether there are any inherent connective tissue disorders (which leads to tissue weakness and injury). Both connective tissue disorders and fitness level affect neuromuscular fatigue, which independently affects proprioception during the game and the probability of injury. Finally, if the sport is a contact sport, the probability of previous injury is greater, as is the probability of minor bruises during the game that would affect proprioception. Although other causal models are also possible, we will use this one for illustrative purposes at this time. For this example, we have decided to include neuromuscular fatigue (Z1) and tissue weakness (Z2) in the statistical model. Step #1 is to ensure that these covariates are not descendants of (i.e. directly or indirectly caused by) warm-up exercises. Step 2 is illustrated in 2b. The open circle (previous injury, Z3) represents the only non-ancestor (an ancestor is direct or indirect cause of another variable) of warm up exercises (X), neuromuscular fatigue (Z1), tissue weakness (Z2) and injury (Outcome). It is therefore deleted from the causal diagram in figure 2b.
Figure 3
Figure 3
a-b. In Step 3 (3a), all arrows emanating from X are deleted. In Step 4 (3b), one joins all parents of a common child. We have used dashed lines here for clarity.
Figure 4
Figure 4
a-b. In Step 5 (4a), we strip all the arrowheads off all the lines. In Step 6 (4b), all lines touching the covariates neuromuscular fatigue (Z1) and tissue weakness (Z2) are deleted. Because the exposure of interest (warm up exercises) is dissociated from the Outcome (injury) after Step 6, the statistical model that includes the covariates neuromuscular fatigue and tissue weakness minimizes the potential bias for the estimate of effect of warm up exercises on the risk of injury.
Figure 5
Figure 5
a-c. This example illustrates the effect of adding the covariate "previous injury" (Z3) to the statistical model used for the causal diagram in Figure 2a. Note that previous injury is associated with both warming up (through team motivation/aggression) and the outcome injury (through Contact Sport). After completing steps 1–4, one is left with figure 5b. Because previous injury (Z3) is included in the model, it has not been deleted from the causal diagram in Step 2, and one must join its ancestors (dotted line). Figure 5c represents the causal diagram after completing Steps 5–6. Because warm up is not dissociated from the outcome risk of injury in figure 5c, the statistical model that includes the covariates Z1, Z2, and Z3 will yield a biased estimate of warm up on the risk of injury.
Figure 6
Figure 6
a-b. Figure 6a is an example of an alternative causal diagram to figure 2a. The only difference between the two is an additional causal relationship where previous injury causes a decrease in pre-game proprioception (we have also included the additional conditional associations that occur as a result of this change with dotted lines). We are still interested in the causal effects of warm-up on injury risk. Because previous injury is an ancestor of warm up exercises (previous injury causes a decrease in pre-game proprioception which causes an increase in warm up exercises), it is not deleted in Step 2. This leads to two effects. First, contact sport is now a common cause of exposure and outcome. Second, there are additional conditional associations in Step 4 (dotted lines) even if "Previous Injury" is not conditioned on in the statistical model because one is already conditioning on a descendant of previous injury (i.e. the main exposure of interest, warm-up); the effect estimate of warm-up on injury is biased if the statistical model includes only warm-up, neuromuscular fatigue and tissue weakness. Figure 6b shows the same causal diagram as 6a (without the conditional associations), but now a causal link is added from pre-game proprioception to intra-game proprioception.
Figure 7
Figure 7
a-b. Figure 7a represents the causal diagram in Figure 6b after step 5 (dark dotted line represents the additional conditional association due to the new causal link in figure 6b), and Figure 7b shows the result after step 6 if one conditions on Tissue Weakness, Neuromuscular Fatigue, Previous Injury and Contact Sport. The presence of a path through the variables Warm-up Exercise, Pre-game proprioception (directly, or indirectly through Team Motivation/Aggression) and Intra-game proprioception to Injury means that we would still obtain a biased estimate for the causal effect of warm-up on the risk of injury.

References

    1. Rothman KJ, Greenland S. Causation and causal inference. In: Rothman KJ, Greenland S, editor. Modern Epidemiology. Vol. 2. Philadelphia: Lippencott-Raven Publishers; 1998. pp. 7–28.
    1. Hernan MA. A definition of causal effect for epidemiological research. J Epidemiol Community Health. 2004;58:265–271. doi: 10.1136/jech.2002.006361. - DOI - PMC - PubMed
    1. Greenland S, Morgenstern H. Confounding in health research. Annu Rev Public Health. 2001;22:189–212. doi: 10.1146/annurev.publhealth.22.1.189. - DOI - PubMed
    1. Rothman KJ, Greenland S. Precision and validity in epidemiologic studies. In: Rothman KJ, Greenland S, editor. Modern Epidemiology. Vol. 2. Philadelphia: Lippencott-Raven Publishers; 1998. pp. 115–134.
    1. Hernan MA, Hernandez-Diaz S, Robins JM. A structural approach to selection bias. Epidemiology. 2004;15:615–625. doi: 10.1097/01.ede.0000135174.63482.43. - DOI - PubMed

Publication types