. 2008 Oct 30;9(1):70.
doi: 10.1186/1465-9921-9-70.

Abnormal spatial diffusion of Ca2+ in F508del-CFTR airway epithelial cells

Affiliations

Abnormal spatial diffusion of Ca2+ in F508del-CFTR airway epithelial cells

Fabrice Antigny et al. Respir Res. .

Abstract

Background: In airway epithelial cells, calcium mobilization can be elicited by selective autocrine and/or paracrine activation of apical or basolateral membrane heterotrimeric G protein-coupled receptors linked to phospholipase C (PLC) stimulation, which generates inositol 1,4,5-trisphosphate (IP3) and 1,2-diacylglycerol (DAG) and induces Ca2+ release from endoplasmic reticulum (ER) stores.

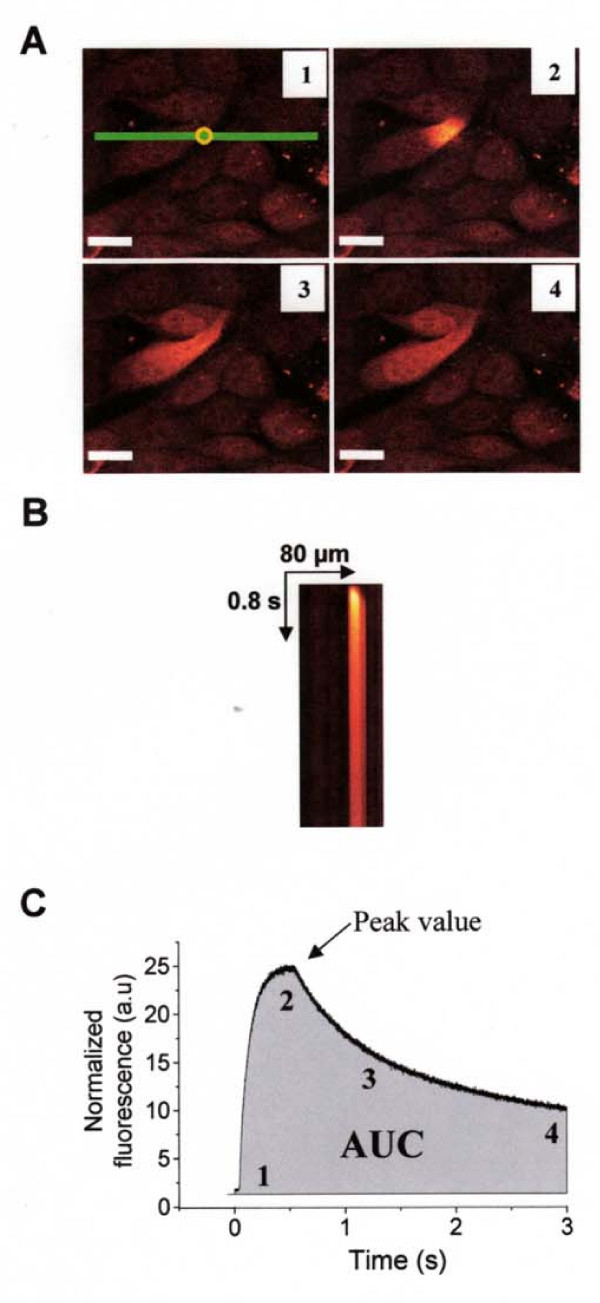
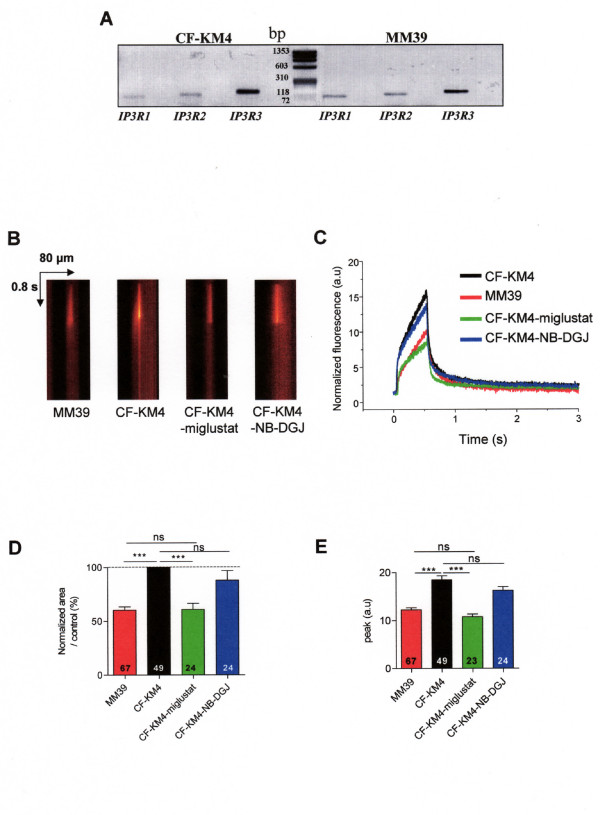
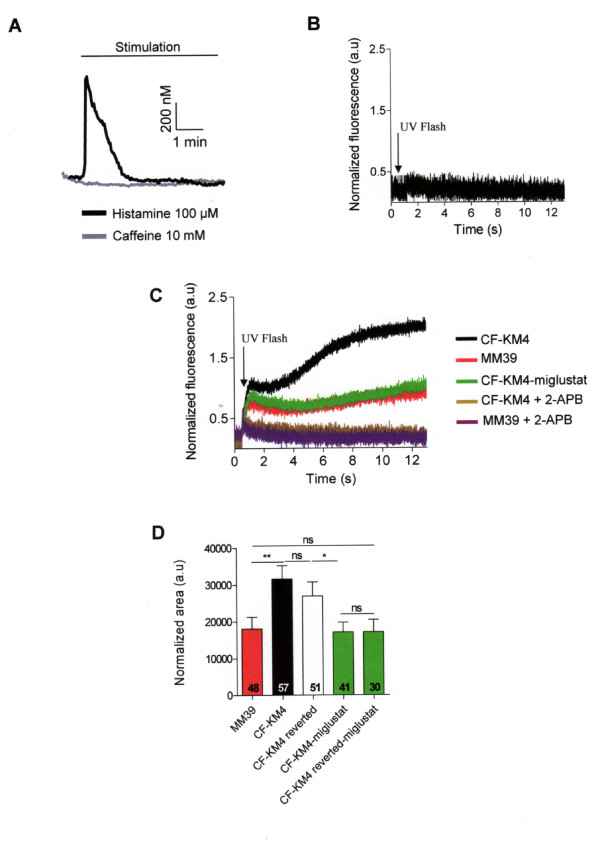
Methods: In the present study, we monitored the cytosolic Ca2+ transients using the UV light photolysis technique to uncage caged Ca2+ or caged IP3 into the cytosol of loaded airway epithelial cells of cystic fibrosis (CF) and non-CF origin. We compared in these cells the types of Ca2+ receptors present in the ER, and measured their Ca2+ dependent activity before and after correction of F508del-CFTR abnormal trafficking either by low temperature or by the pharmacological corrector miglustat (N-butyldeoxynojirimycin).

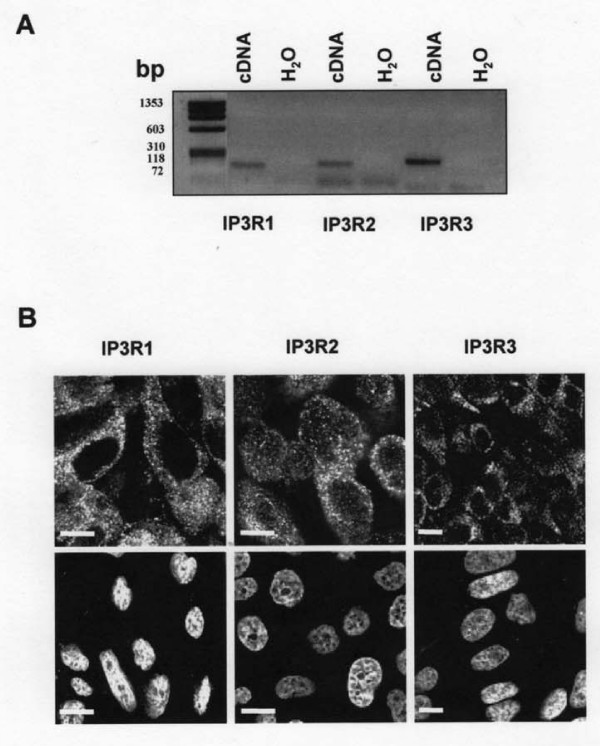
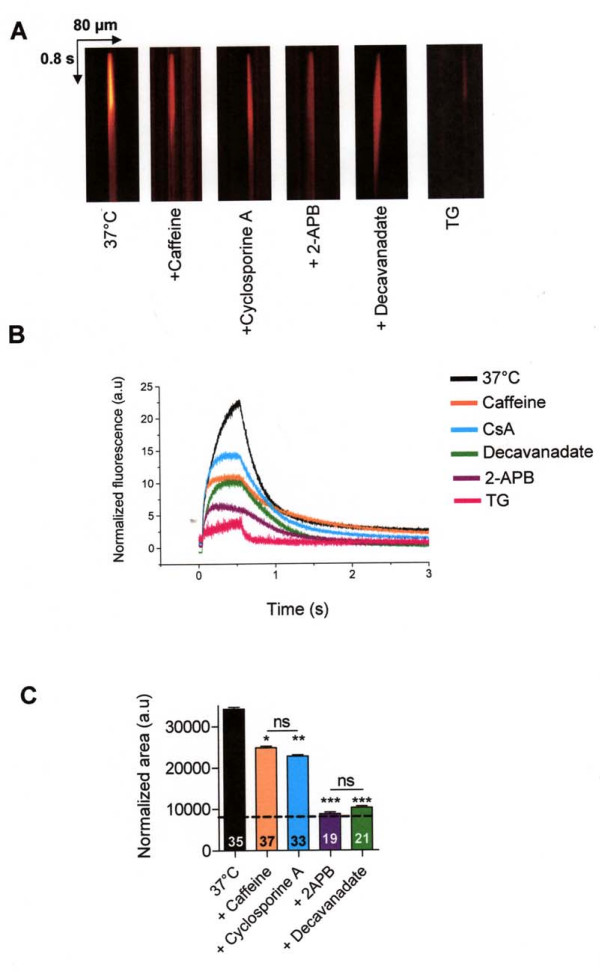
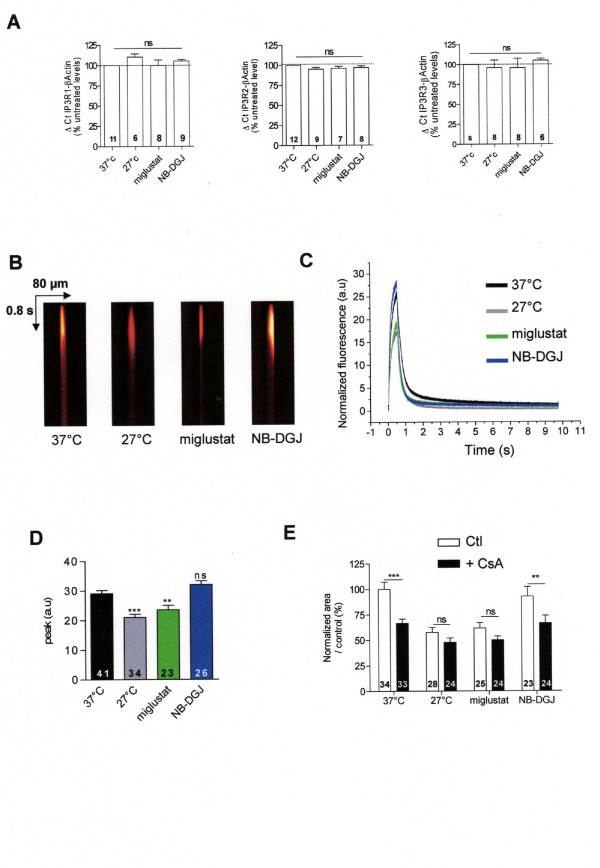
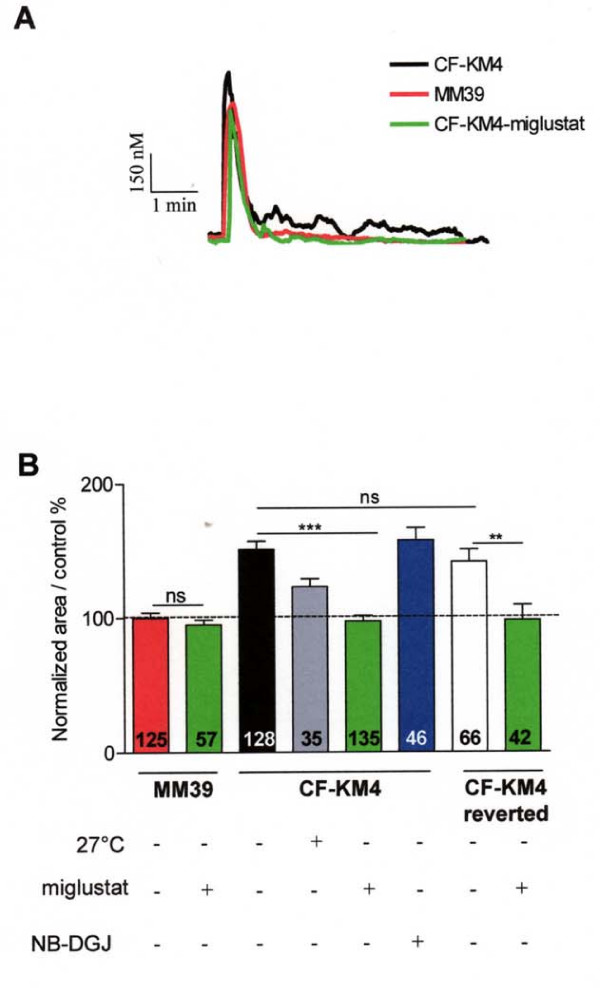
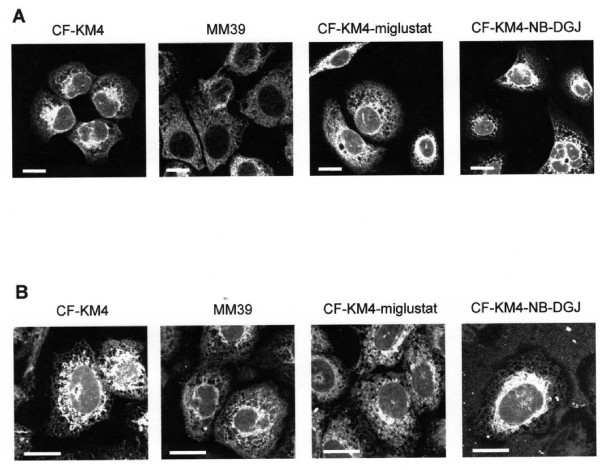
Results: We showed reduction of the inositol 1,4,5-trisphosphate receptors (IP3R) dependent-Ca2+ response following both correcting treatments compared to uncorrected cells in such a way that Ca2+ responses (CF+treatment vs wild-type cells) were normalized. This normalization of the Ca2+ rate does not affect the activity of Ca2+-dependent chloride channel in miglustat-treated CF cells. Using two inhibitors of IP3R1, we observed a decrease of the implication of IP3R1 in the Ca2+ response in CF corrected cells. We observed a similar Ca2+ mobilization between CF-KM4 cells and CFTR-cDNA transfected CF cells (CF-KM4-reverted). When we restored the F508del-CFTR trafficking in CFTR-reverted cells, the specific IP3R activity was also reduced to a similar level as in non CF cells. At the structural level, the ER morphology of CF cells was highly condensed around the nucleus while in non CF cells or corrected CF cells the ER was extended at the totality of cell.

Conclusion: These results suggest reversal of the IP3R dysfunction in F508del-CFTR epithelial cells by correction of the abnormal trafficking of F508del-CFTR in cystic fibrosis cells. Moreover, using CFTR cDNA-transfected CF cells, we demonstrated that abnormal increase of IP3R Ca2+ release in CF human epithelial cells could be the consequence of F508del-CFTR retention in ER compartment.


Figures

Figure 1
Figure 1
Determination of localized Ca2+ mobilization by Ca2+ caged technique. A Confocal XY images illustrating Ca2+ release by photolysis of NP-EGTA molecule. The uncaging pulses were delivered with 5% of 405 nm diode for 500 ms with tornado scanning mode in a region of interest of 10 pixels diameter (yellow circle). Scale bars 25 μm. B XT images were obtained by acquisition in line scan mode (green line in A) during 3 s. C Typical intensity profile of Ca2+ variation was extracted from XT images presented in B, the grey area represents the measure of area under the curve (AUC). The number 1 to 4 represented the Ca2+ response induce by the photolysis at different time (in figure 1A and 1C). All the parameters automatically measured with a computer program developed in our laboratory under IDL 5.3 structured language were represented on the typical intensity profile (peak and kinetics parameters).
Figure 2
Figure 2
Characterization of IP3Rs isoforms in human nasal epithelial cells. A mRNA amplification of 3 isoforms of IP3R by real time PCR. B Immunostaining of IP3R type 1, 2 and 3 in untreated CF15 cells and staining with the secondary antibody as a negative control (bottom panels); nuclei are labelled with TOPRO-3, bar = 10 μm.
Figure 3
Figure 3
Pharmacology of IP3R response of local uncaging of caged Ca2+ in CF15 cells in absence of extracellular Ca2+. A Example of line-scan images acquired at 2 ms per line and 0.21 μm per pixel in CF15 cells untreated at 37°C in presence or not of 100 μM 2-APB, 100 μM decavanadate, 20 mM caffeine or 10 μM cyclosporine A (all were preincubated during 10 min) and after 2 h incubation with 10 μM thapsigargin (TG). B Average of the line-scan images in A expressed as normalized fluorescence in each conditions C Mean normalized area measured from XT images in each experimental condition. The dash line represents the response induced by the flash only, after complete ER Ca2+ store depletion. Results are presented as mean ± SEM and the number of experiments is noted on each bar graph. * P < 0.05; ** P < 0.01*** P < 0.001; ns, non significant difference.
Figure 4
Figure 4
Modification of local stimulation of caged Ca2+ in corrected F508del-CFTR CF15 cells. A Relative mRNA expression level of IP3R-1, IP3R-2, and IP3R-3 in different conditions compared to βActin mRNA expression. B Example of line-scan images acquired at 2 ms per line and 0.21 μm per pixel in CF15 cells treated (27°C, miglustat, NB-DGJ and uncorrected at 37°C in absence of extracellular Ca2+). C Average of the line-scan images in B expressed as normalized fluorescence in absence of extracellular Ca2+. D Histograms showing the amplitude of IP3Rs Ca2+ response in various experimental conditions as indicated. E Mean normalized area in each experimental treatment in absence or presence of 10 μM CsA. Sets of data were compared to the control CF15. Results are presented as mean ± SEM and the number of experiments is noted on each bar graph. ** P < 0.01, *** P < 0.001; ns, non significant difference.
Figure 5
Figure 5
F508del-CFTR correction in CF-KM4 cells restored histamine ER Ca2+ release compared to non CF MM39 cells. A mRNA amplification of 3 isoforms of IP3R by real time PCR in MM39 and CF-KM4 cells. B Example of line-scan images acquired in MM39 cells and in uncorrected or corrected CF-KM4 cells in absence of extracellular Ca2+. These cells were incubated 2 h at 37°C with 100 μM miglustat or 100 μM NB-DGJ. C Average of the line-scan images in A expressed as normalized fluorescence in each conditions. D Histogram of the normalized area under curve of intensity profile of Ca2+ response extracted from A in various experimental conditions as indicated. E Mean of amplitude of Ca2+ response in each experimental condition. Results are presented as mean ± SEM and the number of experiments is noted on each bar graph. *** P < 0.001; ns, non significant difference.
Figure 6
Figure 6
F508del-CFTR correction in CF-KM4 cells restored local Ca2+ wave propagation compared to non CF MM39 cells. A Typical traces of Ca2+ mobilization in miglustat-treated and untreated CF-KM4 and MM39 during 5 min stimulation by 100 μM histamine in absence of extracellular Ca2+. B Histogram of the normalized area under the curve corresponding to the cytoplasmic Ca2+ mobilization induced by 100 μM histamine (in 0 mM Ca2+) after various treatments. These cells were incubated 2 h at 37°C with 100 μM miglustat (for MM39, CF-KM4 and CF-KM4 reverted cells) or 24 h at 27°C, 100 μM NB-DGJ for CF-KM4 cells. The number on each bar indicates the number of cells. **P < 0.01, *** P < 0.001; ns, non significant difference.
Figure 7
Figure 7
Flash photolysis of iso-Ins(1,4,5)P3/PM induced release from internal stores in human tracheal gland cells. A Typical traces of Ca2+ mobilization in CF-KM4 cells during 5 min stimulation by 100 μM histamine or 10 mM caffeine in absence of extracellular Ca2+. B The CF-KM4 cells were loaded with fluo-4 and without iso-Ins(1,4,5)P3/PM and stimulated by UV light. C Traces show average normalized fluo4 fluorescence recordings in uncorrected or corrected CF-KM4 (incubated 2 h at 37°C with 100 μM miglustat) and in MM39 cells in absence of extracellular Ca2+. These cells were preincubated during 10 min in presence or not of 100 μM 2-APB. D Histogram of the normalized area under curve of intensity profile of Ca2+ response in various experimental conditions as indicated. These cells were incubated 2 h at 37°C with 100 μM miglustat (CF-KM4 and CF-KM4 reverted cells). Results are presented as mean ± SEM and the number of experiments is noted on each bar graph. * P < 0.05; ** P < 0.01*** P < 0.001; ns, non significant difference.
Figure 8
Figure 8
ER morphology in uncorrected or corrected CF human tracheal gland cells compared to non CF human tracheal gland cells. A Immunostaining of calreticulin in untreated CF-KM4, MM39 and miglustat (100 μM 2 h) or NB-DGJ (100 μM 2 h) treated CF-KM4 cells. Nuclei are labelled with TOPRO-3, bar = 10 μm. B ER imaging (with ER tracker probes) in untreated or miglustat (100 μM 2 h) or NB-DGJ (100 μM 2 h) treated CF-KM4 cells and in untreated MM39 cells, bar = 10 μm.
Figure 9
Figure 9
ER Ca2+ release decreased after F508del-CFTR correction, what is the consequence on calcium-activated chloride channel (CaCC) activity? A Example of mean iodide efflux for activation of CaCC in miglustat-treated (black symbol) or not (open symbol) MM39 cells. CaCC were stimulated by 100 μM ATP in 0 mM Ca2+ bath medium. B Histograms show the mean relative rate for the experimental conditions (1 μM A23187, 100 μM ATP or 100 μM histamine) indicated below each bar (n = 4) in miglustat-treated (black bars) or not (open bars) MM39 cells. C Examples of mean iodide efflux for activation of CaCC in miglustat-treated (black symbol) or not (open symbol) CF-KM4 cells. CaCC were stimulated as for MM39 cells. D Histograms show the mean relative rate for the experimental conditions indicated below each bar (n = 4) in miglustat-treated (black bars) or not (open bars) CF-KM4 cells. Results are presented as mean ± S.E.M; ns, non significant difference.

References

    1. Bezprozvanny I, Watras J, Ehrlich BE. Bell-shaped calcium-response curves of Ins(1,4,5)P3- and calcium-gated channels from endoplasmic reticulum of cerebellum. Nature. 1991;351:751–754. doi: 10.1038/351751a0. - DOI - PubMed
    1. De Smedt H, Missiaen L, Parys JB, Henning RH, Sienaert I, Vanlingen S, et al. Isoform diversity of the inositol trisphosphate receptor in cell types of mouse origin. Biochem J. 1997;322(Pt 2):575–583. - PMC - PubMed
    1. Thrower EC, Hagar RE, Ehrlich BE. Regulation of Ins(1,4,5)P3 receptor isoforms by endogenous modulators. Trends Pharmacol Sci. 2001;22:580–586. doi: 10.1016/S0165-6147(00)01809-5. - DOI - PubMed
    1. Hagar RE, Burgstahler AD, Nathanson MH, Ehrlich BE. Type III InsP3 receptor channel stays open in the presence of increased calcium. Nature. 1998;396:81–84. doi: 10.1038/23954. - DOI - PMC - PubMed
    1. Antigny F, Norez C, Becq F, Vandebrouck C. Calcium homeostasis is abnormal in cystic fibrosis airway epithelial cells but is normalized after rescue of F508del-CFTR. Cell Calcium. 2008;43:175–183. doi: 10.1016/j.ceca.2007.05.002. - DOI - PubMed

Publication types

Substances