. 2008 Nov 1;68(21):8954-67.
doi: 10.1158/0008-5472.CAN-07-6088.

DNA hypomethylation arises later in prostate cancer progression than CpG island hypermethylation and contributes to metastatic tumor heterogeneity

Affiliations

DNA hypomethylation arises later in prostate cancer progression than CpG island hypermethylation and contributes to metastatic tumor heterogeneity

Srinivasan Yegnasubramanian et al. Cancer Res. .

Abstract

Hypomethylation of CpG dinucleotides in genomic DNA was one of the first somatic epigenetic alterations discovered in human cancers. DNA hypomethylation is postulated to occur very early in almost all human cancers, perhaps facilitating genetic instability and cancer initiation and progression. We therefore examined the nature, extent, and timing of DNA hypomethylation changes in human prostate cancer. Contrary to the prevailing view that global DNA hypomethylation changes occur extremely early in all human cancers, we show that reductions in (5me)C content in the genome occur very late in prostate cancer progression, appearing at a significant extent only at the stage of metastatic disease. Furthermore, we found that, whereas some LINE1 promoter hypomethylation does occur in primary prostate cancers compared with normal tissues, this LINE1 hypomethylation is significantly more pronounced in metastatic prostate cancer. Next, we carried out a tiered gene expression microarray and bisulfite genomic sequencing-based approach to identify genes that are silenced by CpG island methylation in normal prostate cells but become overexpressed in prostate cancer cells as a result of CpG island hypomethylation. Through this analysis, we show that a class of cancer testis antigen genes undergoes CpG island hypomethylation and overexpression in primary prostate cancers, but more so in metastatic prostate cancers. Finally, we show that DNA hypomethylation patterns are quite heterogeneous across different metastatic sites within the same patients. These findings provide evidence that DNA hypomethylation changes occur later in prostate carcinogenesis than the CpG island hypermethylation changes and occur heterogeneously during prostate cancer progression and metastatic dissemination.


Figures

Figure 1
Figure 1
Overall genomic 5meC content is significantly reduced in metastatic but not primary prostate cancer. A, 5meC content is reduced in multiple prostate cancer cell lines compared to normal prostate epithelial and stromal cells. An LC-MS/MS analysis was used to determine the 5meC content as a fraction of total cytosine content in 6 prostate cancer cell lines, normal prostate epithelial cells (PrEC) in primary culture, prostate stromal cells in culture (4ST), WBC DNA pooled from multiple normal male volunteers, and from control specimens. Controls included the M.Oligo which was synthesized with 80% 5meC content, and WBC genomic DNA in which all CpG dinucleotides were methylated to completion with the M.SssI methyltransferase in vitro (WBC-SssI). All prostate cancer cell lines, except DU-145, showed reduced 5meC content compared to normal cells. B, 5meC content is significantly reduced in metastatic but not primary prostate cancer compared to benign prostate. Application of the same LC-MS/MS approach as above for determination of genomic 5meC content in a series of normal prostate tissues from organ donors (green), tumor adjacent benign prostate tissues from radical prostatectomy specimens, including 11 of 12 containing PIA and PIN prostate cancer precursor lesions (orange), primary prostate cancers from radical prostatectomy specimens (red), hormone naïve lymph node metastases (brown), and metastatic prostate cancers from a rapid autopsy series of men dying of advanced hormone-refractory prostate cancer (maroon). Shown are box-and-whisker plots of the 5meC contents in each specimen. The number of specimens analyzed in each prostate tissue category is indicated., For the autopsy metastases, 86 metastatic deposits from 28 subjects (1 - 7 mets from each subject) were analyzed. The results of t-test for all statistically significant differences in the mean 5meC content between all pairwise combinations are shown. Differences that remained significant after adjusting for age are indicated with *,p < 0.05, or,p < 0.0005.C, Representative images of immunohistochemistry experiments with anti-5meC antibodies in benign prostate sections from organ donors, primary prostate cancer sections from radical prostatectomies, and metastatic prostate cancer sections from a rapid autopsy series, all assembled in tissue microarrays. Each representative section was imaged in both 20x and 40x original magnification as indicated. D, Quantitative image analysis of 5meC immunohistochemistry experiments on prostate tissue TMAs confirms that metastatic prostate cancer tissues (brown), but not primary prostate cancer tissues (red), have significantly reduced genomic 5meC content compared to normal prostate tissues (green). Shown are box-and-whisker plots of the median intensity as determined by quantitative image analysis of 5meC stained TMAs. The number of specimens analyzed for each prostate tissue category is indicated. The results of t-test for differences in the mean 5meC content between all pairwise combinations are shown for all p < 0.1., For the autopsy metastases, 86 metastatic deposits from 28 subjects (1 - 7 mets from each subject) were analyzed. , For the autopsy metastases, 116 metastatic deposits from 32 subjects (1 - 7 mets from each subject) were analyzed.
Figure 2
Figure 2
Compared to benign prostate, reduction of LINE1 promoter methylation occurs to some extent in primary prostate cancer, but to a greater extent in metastatic prostate cancer. A, An overview of the COMPARE assay used to detect LINE1 hypomethylation as well as gene- specific CpG island hypomethylation. Each sample is split into an untreated fraction and an M.SssI treated fraction in which all CpG dinucleotides are methylated to completion using the M.SssI methyltransferase enzyme. Each fraction is fragmented with restriction enzymes and then densely methylated fragments are captured and enriched with magnetic-bead immobilized MBD2-MBD polypeptides that specifically bind to densely methylated genomic DNA fragments with high avidity. Enriched fragments are eluted and the amount of a given genomic region of interest is determined by real-time PCR. The ratio of the amount of methylated fragments in the untreated fraction to that in the M.SssI treated sample, called the Methylation Index (MI), gives an estimate of the fraction of input genomic DNA fragments that were methylated at a given region of interest. B, LINE1 promoter methylation is reduced to varying extents in prostate cancer cell lines compared to normal prostate epithelial (PrEC) and stromal (4ST) cells and normal WBCs as seen by application of the COMPARE assay for detection of methylation at consensus LINE1 promoter regions. C, Application of the COMPARE LINE1 promoter hypomethylation assays to genomic DNA from prostate tissues shows that primary prostate cancers (red) and metastatic prostate cancers (brown and maroon) have significantly reduced LINE1 promoter methylation compared to organ donor normal prostates (green) and tumor adjacent benign prostate tissues including PIA and PIN lesions (green). Shown are box-and-whisker plots of the Methylation Index at LINE1 promoter elements. The extent of LINE1 promoter methylation was even more pronounced in metastatic prostate cancers compared to primary prostate cancers. Number of specimens analyzed for each prostate tissue category is indicated. , For the autopsy metastases, 76 metastatic deposits from 28 subjects (1 - 7 mets from each subject) were analyzed. The results of t-test for all statistically significant differences in the mean 5meC content between all pairwise combinations are shown. Differences that remained significant after adjusting for age are indicated with *,p < 0.05, or ,p < 0.005.
Figure 3
Figure 3
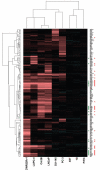
Identification of genes that are not expressed in normal prostate epithelial and stromal cells, but expressed with high confidence in prostate cancer cell lines. Hierarchical clustering and “heat-mapping” of Z-scores from “Bar Code” analysis of gene expression data from Affymetrix hgU133a microarray experiments shows that this analysis identified 168 genes with absence of significant expression in the normal prostate epithelial and stromal cells, but very high confidence of absolute expression in at least one of the prostate cancer cell lines. These genes were considered candidate hypomethylated genes. Green bars indicate known cancer-testis antigen genes identified by this analysis. Red bars indicate genes that were selected for bisulfite sequencing analysis. Details of all genes in this figure are given in Supp. Table S1.
Figure 4
Figure 4
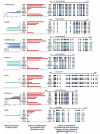
Hypomethylation of gene specific CpG islands (CpG islands) is correlated with expression of the corresponding genes. Right Panels, Extent of methylation at genes that were found to be hypomethylated in prostate cancer cell lines by bisulfite sequencing. For each sample, multiple alleles (number shown to the right of each sample) of each CpG island were cloned and sequenced after bisulfite modification and amplification. The frequency of methylation across all alleles for each CpG dinucleotide was color scaled from black (all alleles methylated) to light blue (none of the alleles methylated). A schematic of each CpG island, with position, relative to the transcriptional start site, of the start and end of the bisulfite sequencing amplicon and the position of each CpG (vertical hash marks) within each amplicon is shown for each gene above the summary alleles for each specimen. These figures represent a summary of the complete data shown in Supplementary Figure S2, which shows the pattern of methylation in each bisulfite sequenced clone individually. NA, not amplifiable. Middle Panels, Extent of methylation at the same genes as in the Right Panels as determined by the COMPARE assay. For each sample, the Methylation Index is shown on the x-axis. NA, the M.SssI treated fraction for these specimens were not amplifiable and therefore these specimens were not informative. Data from COMPARE assays closely parallel data from bisulfite sequencing experiments. Left Panels, Extent of expression at the same genes as in the Middle and Right Panels as determined by Affymetrix hgU133A gene expression microarrays. For each sample, the extent of methylation, in normalized arbitrary expression units, is shown on the x-axis. When multiple genes contained identical 5′ CpG island sequences, expression levels of all associated genes are shown.
Figure 5
Figure 5
Gene specific CpG island hypomethylation occurs in primary prostate cancer, but is more pronounced in metastatic prostate cancer. A, Box-and-whisker plots showing the Methylation Index as determined by COMPARE assay at each of the CpG islands found to be hypomethylated in the prostate cancer cell lines. The results of t-test for all statistically significant differences in the mean 5meC content between all pairwise combinations within each gene are shown, with *, p < 0.05; **, p < 0.005; *** p < 0.0005. Statistically significant trends in CTA gene methylation with primary > hormone naïve lymph node metastases > hormone refractory autopsy metastases are indicated with , p < 0.05 or ‡‡, p < 0.005., indicates that differences remained statistically significant after age adjusting. . The number of specimens analyzed in each prostate tissue category is indicated in the legend. ††, For the autopsy metastases, 76 metastatic deposits from 28 subjects (1 - 7 mets from each subject) were analyzed. B, Immunohistochemistry with anti-NY-ESO-1 antibodies in prostate cancer cell lines. NY-ESO-1 protein (encoded by the CTAG1B gene) staining was seen in cell lines that had a high degree of hypomethylation at this gene CpG island (CWR22Rv1 and LAPC-4) but not in the other prostate cancer cell lines. C, Immunohistochemistry with anti-NY-ESO-1 antibodies in prostate tissues and control normal testis tissues. No NY-ESO-1 protein staining was observed in any of the benign prostate and primary prostate tissues tested. Robust staining was seen in the testis and in 13% of metastatic prostate cancers. Representative positive staining sections of metastatic prostate tissues and normal testis are shown. Boxed regions are shown in higher magnification. Original optical magnifications are indicated.
Figure 6
Figure 6
DNA hypomethylation changes are more heterogeneous across different metastatic deposits within the same individual than CpG island hypermethylation changes. A, Comparison of the pattern of CpG island hypermethylation changes with the pattern of gene-specific CpG island hypomethylation, LINE1 hypomethylation, and 5meC content reduction changes in multiple metastatic deposits from different subjects. CpG island hypermethylation data, collected by real-time Methylation Specific PCR (RT-MSP), were obtained from a previous study (18) and are color-scaled with red representing complete methylation of >99% (hypermethylation) of input alleles and white representing no methylation. *, in the hypermethylation data indicate that there was a low but detectable level of hypermethylation. DNA hypomethylation data at gene specific CpG islands and at LINE1 promoters, as determined in this study on the same samples and cases as the previous study examining CpG island hypermethylation changes, were color-scaled with white representing >99% of all input alleles being methylated and dark blue representing no methylation (hypomethylation). 5meC content was color scaled with white representing a 5meC content > 0.04 (corresponding to the levels seen in normal WBCs) and dark blue representing no 5meC content. On average, hypomethylation changes were more variable across sites within the same subject compared to the CpG island hypermethylation changes (for gene-specific CpG islands, p << 10−10; for LINE1 promoter hypomethylation, p < 10−3; for 5meC content, p < 10−5). Each subject or case is shown as a distinct module with all of the metastatic sites and methylation data for that subject separated from other subjects. B, Representative images of 5meC immunohistochemistry in multiple metastases each from different subjects. The degree of 5meC staining in different metastatic deposits within each subject was highly variable. Shown are multiple deposits from two representative subjects. The original optical magnification is indicated. C, Representative images of NY-ESO-1 immunohistochemistry in multiple metastases each from different subjects. The degree of NY-ESO-1 staining was highly heterogeneous in different metastatic deposits within each subject. Shown are multiple deposits from two representative subjects. The original optical magnification is indicated. D, A model of DNA methylation changes in prostate cancer initiation and disease progression.

References

    1. Feinberg AP, Vogelstein B. Hypomethylation distinguishes genes of some human cancers from their normal counterparts. Nature. 1983;301:89–92. - PubMed
    1. Gama-Sosa MA, Slagel VA, Trewyn RW, et al. The 5-methylcytosine content of DNA from human tumors. Nucleic Acids Res. 1983;11:6883–94. - PMC - PubMed
    1. Esteller M, Corn PG, Baylin SB, Herman JG. A gene hypermethylation profile of human cancer. Cancer Res. 2001;61:3225–9. - PubMed
    1. Jones PA, Laird PW. Cancer epigenetics comes of age. Nat Genet. 1999;21:163–7. - PubMed
    1. Karpf AR, Matsui S. Genetic disruption of cytosine DNA methyltransferase enzymes induces chromosomal instability in human cancer cells. Cancer Res. 2005;65:8635–9. - PubMed

Publication types