

Roles for microRNAs, miR-93 and miR-130b, and tumor protein 53-induced nuclear protein 1 tumor suppressor in cell growth dysregulation by human T-cell lymphotrophic virus 1
- PMID: 18974142
- PMCID: PMC2596768
- DOI: 10.1158/0008-5472.CAN-08-0769
Roles for microRNAs, miR-93 and miR-130b, and tumor protein 53-induced nuclear protein 1 tumor suppressor in cell growth dysregulation by human T-cell lymphotrophic virus 1
Abstract
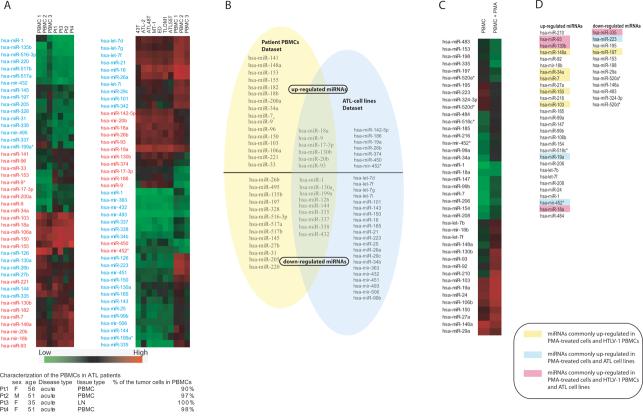
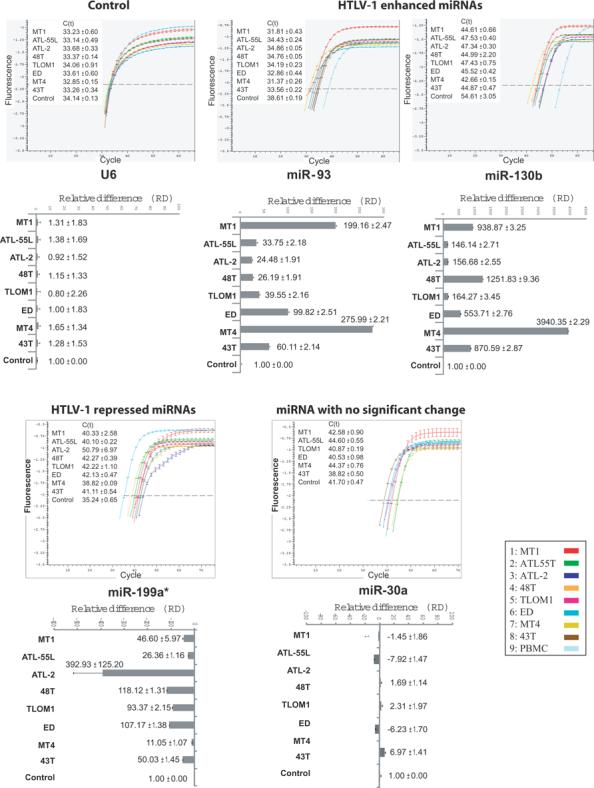
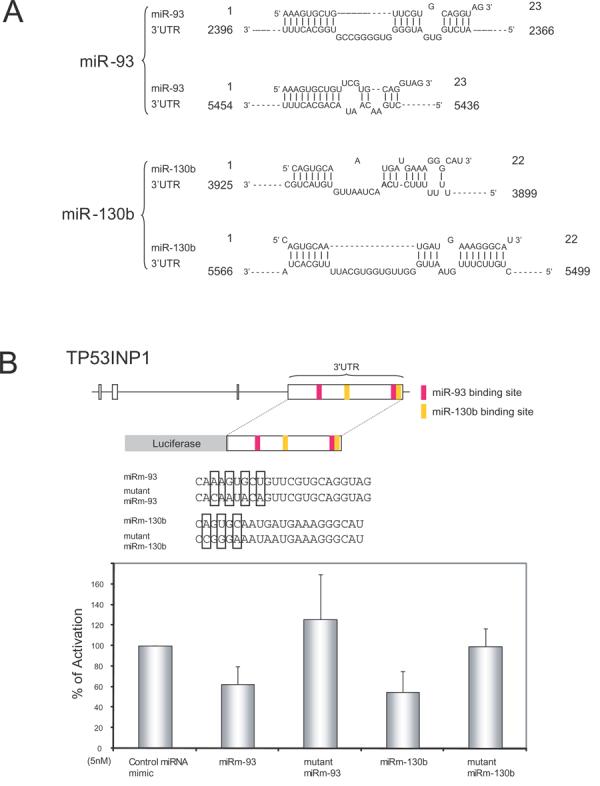
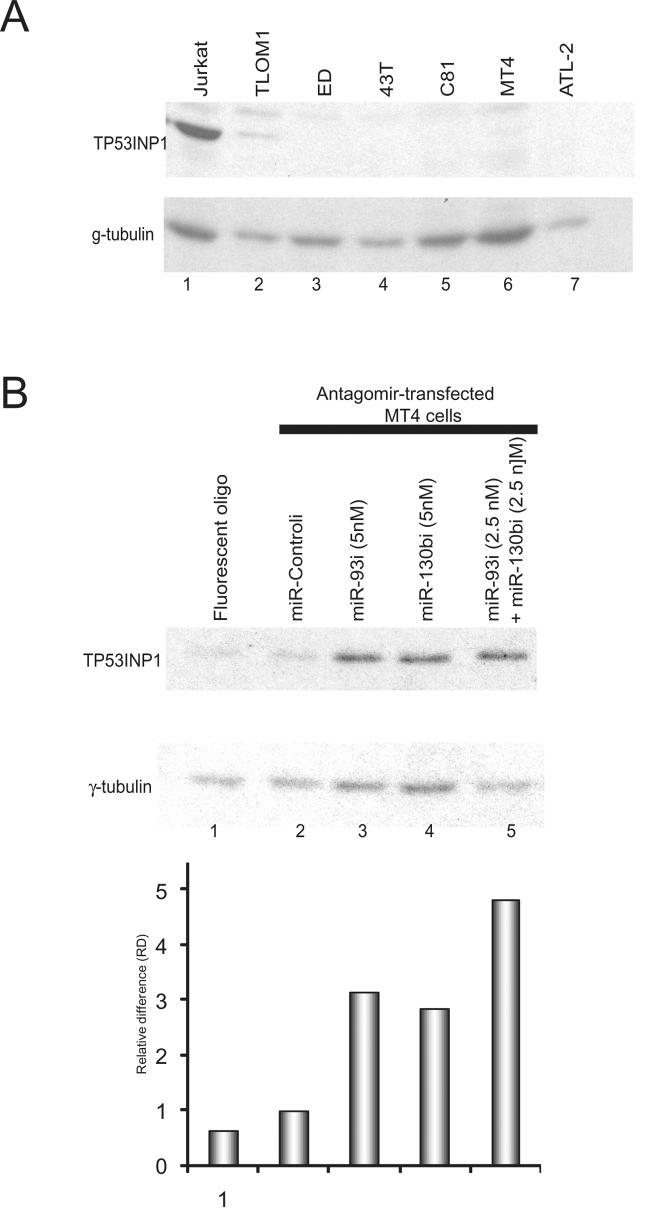
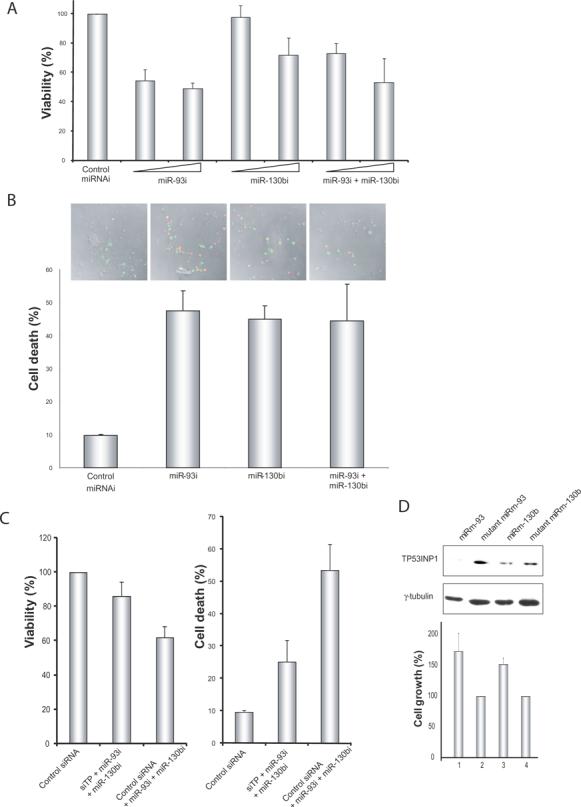
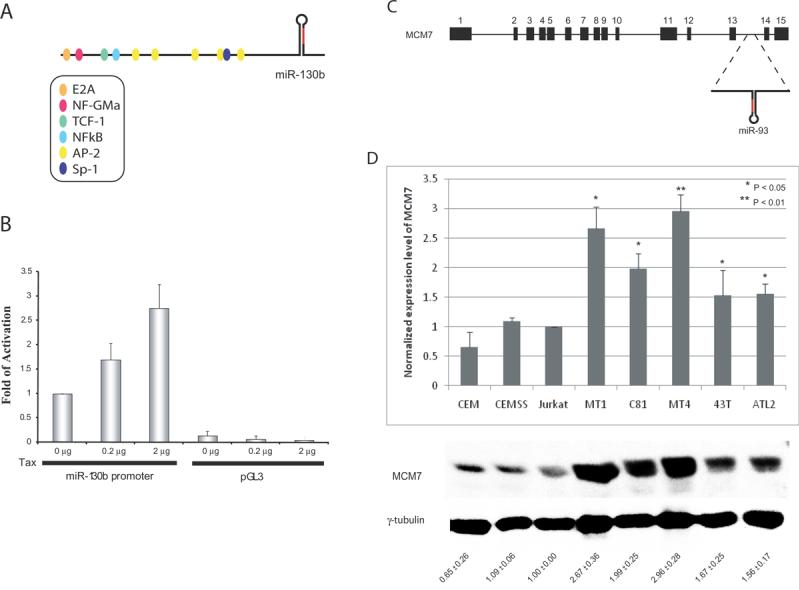
A role for microRNAs (miRNA) in human T-cell leukemia virus 1 (HTLV-1)-mediated cellular transformation has not been described. Here, we profiled miRNA expression in HTLV-1-transformed human T-cell lines and primary peripheral blood mononuclear cells from adult T-cell leukemia patients. Analyses of 11 different profiles revealed six miRNAs that were consistently up-regulated. Two of the up-regulated miRNAs (miR-93 and miR-130b) target the 3' untranslated region (3'UTR) of the mRNA for a tumor suppressor protein, tumor protein 53-induced nuclear protein 1 (TP53INP1). A low expression level of TP53INP1 protein was found in HTLV-1-transformed cells. Additionally, when antagomirs were used to knock down miR-93 and miR-130b in these cells, the expression of TP53INP1 was increased, suggesting that the latter is regulated inside cells by the former. A role for TP53INP1 in regulating cell growth was established by experiments that showed that enhanced TP53INP1 expression increased apoptosis. Collectively, the findings implicate a miR-93/miR-130b-TP53INP1 axis that affects the proliferation and survival of HTLV-1-infected/transformed cells.
Figures
Similar articles
-
A positive feedback loop of p53/miR-19/TP53INP1 modulates pancreatic cancer cell proliferation and apoptosis.Oncol Rep. 2016 Jan;35(1):518-23. doi: 10.3892/or.2015.4361. Epub 2015 Oct 30. Oncol Rep. 2016. PMID: 26531836
-
MiR-155 promotes proliferation of human breast cancer MCF-7 cells through targeting tumor protein 53-induced nuclear protein 1.J Biomed Sci. 2013 Oct 24;20(1):79. doi: 10.1186/1423-0127-20-79. J Biomed Sci. 2013. PMID: 24152184 Free PMC article.
-
microRNA-155 acts as an oncogene by targeting the tumor protein 53-induced nuclear protein 1 in esophageal squamous cell carcinoma.Int J Clin Exp Pathol. 2014 Jan 15;7(2):602-10. eCollection 2014. Int J Clin Exp Pathol. 2014. PMID: 24551280 Free PMC article.
-
The Emerging Role of miRNAs in HTLV-1 Infection and ATLL Pathogenesis.Viruses. 2015 Jul 20;7(7):4047-74. doi: 10.3390/v7072805. Viruses. 2015. PMID: 26205403 Free PMC article. Review.
-
MiR-150 in HTLV-1 infection and T-cell transformation.Front Immunol. 2022 Aug 16;13:974088. doi: 10.3389/fimmu.2022.974088. eCollection 2022. Front Immunol. 2022. PMID: 36072598 Free PMC article. Review.
Cited by
-
An insight to HTLV-1-associated myelopathy/tropical spastic paraparesis (HAM/TSP) pathogenesis; evidence from high-throughput data integration and meta-analysis.Retrovirology. 2019 Dec 30;16(1):46. doi: 10.1186/s12977-019-0508-8. Retrovirology. 2019. PMID: 31888669 Free PMC article.
-
Common threads in persistent viral infections.J Virol. 2010 May;84(9):4116-23. doi: 10.1128/JVI.01905-09. Epub 2009 Dec 2. J Virol. 2010. PMID: 19955304 Free PMC article. Review.
-
Joint analysis of transcriptional and post- transcriptional brain tumor data: searching for emergent properties of cellular systems.BMC Bioinformatics. 2011 Mar 30;12:86. doi: 10.1186/1471-2105-12-86. BMC Bioinformatics. 2011. PMID: 21450054 Free PMC article.
-
ZNRF3 contributes to the growth of lung carcinoma via inhibiting Wnt/β-catenin pathway and is regulated by miR-93.Tumour Biol. 2016 Mar;37(3):3051-7. doi: 10.1007/s13277-015-3949-2. Epub 2015 Sep 30. Tumour Biol. 2016. PMID: 26423400
-
MiR-93 is related to poor prognosis in pancreatic cancer and promotes tumor progression by targeting microtubule dynamics.Oncogenesis. 2020 May 4;9(5):43. doi: 10.1038/s41389-020-0227-y. Oncogenesis. 2020. PMID: 32366853 Free PMC article.
References
-
- Lewis BP, Burge CB, Bartel DP. Conserved seed pairing, often flanked by adenosines, indicates that thousands of human genes are microRNA targets. Cell. 2005;120:15–20. - PubMed
-
- Kato M, Slack FJ. microRNAs: small molecules with big roles - C. elegans to human cancer. Biol Cell. 2008;100:71–81. - PubMed
-
- Lu J, Getz G, Miska EA, varez-Saavedra E, Lamb J, Peck D, et al. MicroRNA expression profiles classify human cancers. Nature. 2005;435:834–8. - PubMed
-
- Matsuoka M, Jeang KT. Human T-cell leukaemia virus type 1 (HTLV-1) infectivity and cellular transformation. Nat Rev Cancer. 2007;7:270–80. - PubMed
Publication types
MeSH terms
Substances
Grants and funding
LinkOut - more resources
Full Text Sources
Other Literature Sources
Molecular Biology Databases
Research Materials
