

Investigating the correspondence between transcriptomic and proteomic expression profiles using coupled cluster models
- PMID: 18974169
- PMCID: PMC4141638
- DOI: 10.1093/bioinformatics/btn553
Investigating the correspondence between transcriptomic and proteomic expression profiles using coupled cluster models
Abstract
Motivation: Modern transcriptomics and proteomics enable us to survey the expression of RNAs and proteins at large scales. While these data are usually generated and analyzed separately, there is an increasing interest in comparing and co-analyzing transcriptome and proteome expression data. A major open question is whether transcriptome and proteome expression is linked and how it is coordinated.
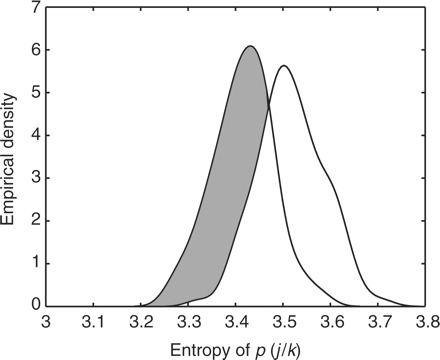
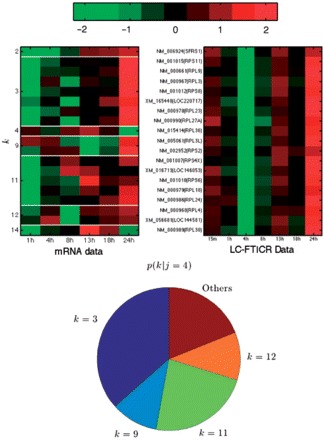
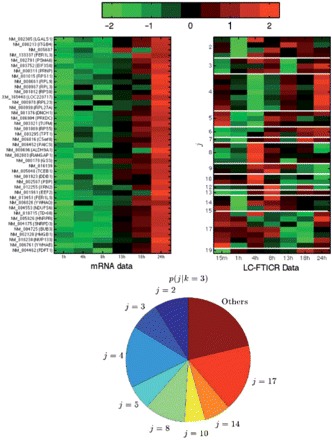
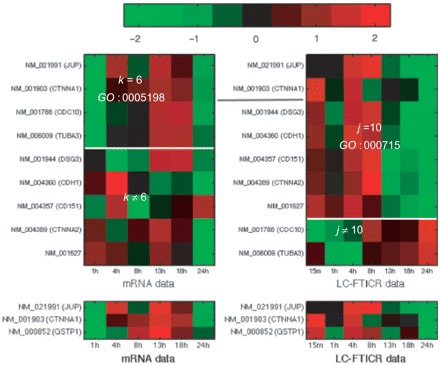
Results: Here we have developed a probabilistic clustering model that permits analysis of the links between transcriptomic and proteomic profiles in a sensible and flexible manner. Our coupled mixture model defines a prior probability distribution over the component to which a protein profile should be assigned conditioned on which component the associated mRNA profile belongs to. We apply this approach to a large dataset of quantitative transcriptomic and proteomic expression data obtained from a human breast epithelial cell line (HMEC). The results reveal a complex relationship between transcriptome and proteome with most mRNA clusters linked to at least two protein clusters, and vice versa. A more detailed analysis incorporating information on gene function from the Gene Ontology database shows that a high correlation of mRNA and protein expression is limited to the components of some molecular machines, such as the ribosome, cell adhesion complexes and the TCP-1 chaperonin involved in protein folding.
Availability: Matlab code is available from the authors on request.
Figures
References
-
- Alizadeh A, et al. Different types of diffuse large b-cell lymphoma identified by gene expressing profiling. Nature. 2000;403:503–511. - PubMed
-
- Barker N, et al. The Yin Yang of TCF/beta-catenin signaling. Adv. Cancer Res. 2000;77:1–24. - PubMed
-
- Chen G, et al. Discordant protein and mRNA expression in lung adenocarcinomas. Mol. Cell. Proteomics. 2002;1:304–313. - PubMed
-
- Chudova D, et al. Gene expression clustering with functional mixture models. In: Thrun S, editor. Advances in Neural Information Processing Systems. Vol. 16 2004.
-
- Dempster A, et al. Maximum likelihood from incomplete data via the em algorithm. J. R. Stat. Soc. B. 1977;39:1–38.
