

Developmental programming: excess weight gain amplifies the effects of prenatal testosterone excess on reproductive cyclicity--implication for polycystic ovary syndrome
- PMID: 18974266
- PMCID: PMC2654744
- DOI: 10.1210/en.2008-1256
Developmental programming: excess weight gain amplifies the effects of prenatal testosterone excess on reproductive cyclicity--implication for polycystic ovary syndrome
Abstract
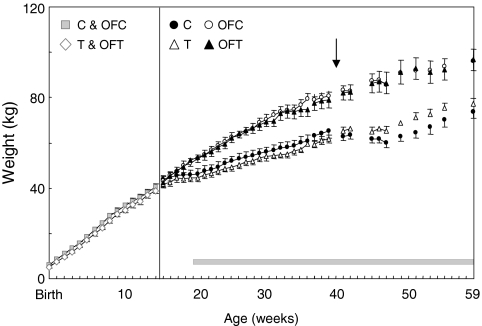
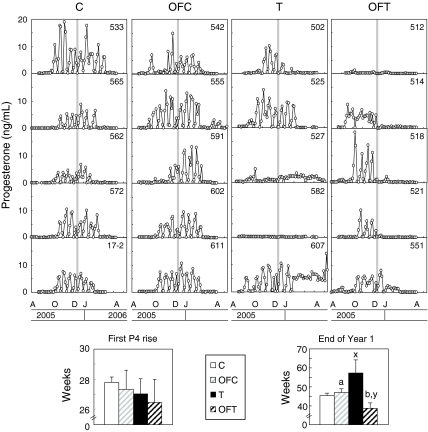
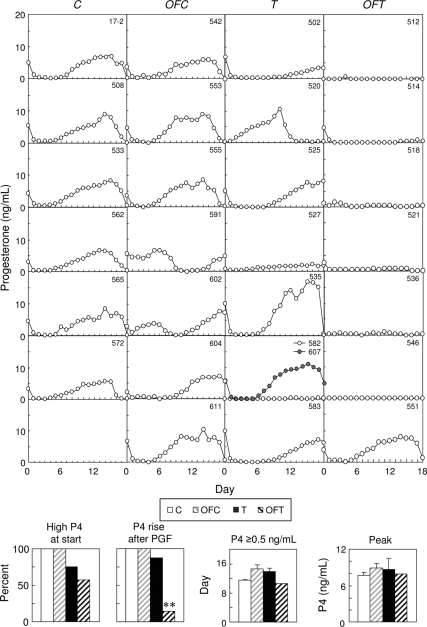
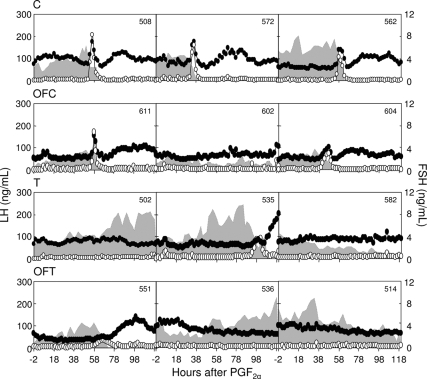
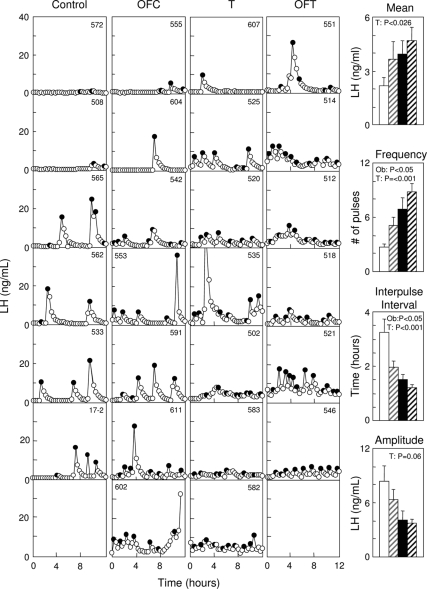
Sheep exposed to testosterone (T) during early to midgestation exhibit reproductive defects that include hypergonadotropism, functional hyperandrogenism, polycystic ovaries, and anovulatory infertility, perturbations similar to those observed in women with polycystic ovary syndrome. Obesity increases the severity of the phenotype in women with polycystic ovary syndrome. To determine whether prepubertal weight gain would exaggerate the reproductive disruptions in prenatal T-treated sheep, pregnant sheep were injected with 100 mg T propionate ( approximately 1.2 mg/kg) im twice weekly, from d 30-90 of gestation. Beginning about 14 wk after birth, a subset of control and prenatal T-treated females were overfed to increase body weight to 25% above that of controls. Twice-weekly progesterone measurements found no differences in timing of puberty, but overfed prenatal T-treated females stopped cycling earlier. Detailed characterization of periovulatory hormonal dynamics after estrous synchronization with prostaglandin F(2alpha) found 100% of controls, 71% of overfed controls, 43% of prenatal T-treated, and 14% of overfed prenatal T-treated females had definable LH surges. Only one of seven overfed prenatal T-treated female vs. 100% of control, 100% of overfed control, and seven of eight prenatal T-treated females exhibited a luteal progesterone increase. Assessment of LH pulse characteristics during the anestrous season found both overfeeding and prenatal T excess increased LH pulse frequency without an interaction between these two variables. These findings agree with the increased prevalence of anovulation observed in obese women with polycystic ovary syndrome and indicate that excess postnatal weight gain amplifies reproductive disruptions caused by prenatal T excess.
Figures
Similar articles
-
Developmental Programming: Prenatal and Postnatal Androgen Antagonist and Insulin Sensitizer Interventions Prevent Advancement of Puberty and Improve LH Surge Dynamics in Prenatal Testosterone-Treated Sheep.Endocrinology. 2015 Jul;156(7):2678-92. doi: 10.1210/en.2015-1235. Epub 2015 Apr 28. Endocrinology. 2015. PMID: 25919188 Free PMC article.
-
Developmental programming: insulin sensitizer treatment improves reproductive function in prenatal testosterone-treated female sheep.Endocrinology. 2010 Aug;151(8):4007-17. doi: 10.1210/en.2010-0124. Epub 2010 Jun 16. Endocrinology. 2010. PMID: 20555028 Free PMC article.
-
Developmental programming: differential effects of prenatal exposure to bisphenol-A or methoxychlor on reproductive function.Endocrinology. 2006 Dec;147(12):5956-66. doi: 10.1210/en.2006-0805. Epub 2006 Aug 31. Endocrinology. 2006. PMID: 16946013
-
Developmental reprogramming of reproductive and metabolic dysfunction in sheep: native steroids vs. environmental steroid receptor modulators.Int J Androl. 2010 Apr;33(2):394-404. doi: 10.1111/j.1365-2605.2009.01024.x. Epub 2010 Jan 12. Int J Androl. 2010. PMID: 20070410 Free PMC article. Review.
-
Reproduction Symposium: developmental programming of reproductive and metabolic health.J Anim Sci. 2014 Aug;92(8):3199-210. doi: 10.2527/jas.2014-7637. J Anim Sci. 2014. PMID: 25074449 Free PMC article. Review.
Cited by
-
Protective Role of 4-(4-Hydroxy-3-methoxyphenyl)-2-Butanone on Prostatic Cells Hyperplasia of Rats and Human, 5α-reductase Inhibition Pathway.J Microsc Ultrastruct. 2021 May 24;9(4):164-169. doi: 10.4103/JMAU.JMAU_37_20. eCollection 2021 Oct-Dec. J Microsc Ultrastruct. 2021. PMID: 35070691 Free PMC article.
-
Developmental origin of reproductive and metabolic dysfunctions: androgenic versus estrogenic reprogramming.Semin Reprod Med. 2011 May;29(3):173-86. doi: 10.1055/s-0031-1275519. Epub 2011 Jun 27. Semin Reprod Med. 2011. PMID: 21710394 Free PMC article. Review.
-
The influence of maternal androgen excess on the male reproductive axis.Sci Rep. 2019 Dec 11;9(1):18908. doi: 10.1038/s41598-019-55436-9. Sci Rep. 2019. PMID: 31827225 Free PMC article.
-
Naturally occurring androgen excess cows are present in dairy and beef herds and have similar characteristics to women with PCOS.J Anim Sci. 2022 Jun 1;100(6):skac151. doi: 10.1093/jas/skac151. J Anim Sci. 2022. PMID: 35648128 Free PMC article.
-
Sheep models of polycystic ovary syndrome phenotype.Mol Cell Endocrinol. 2013 Jul 5;373(1-2):8-20. doi: 10.1016/j.mce.2012.10.005. Epub 2012 Oct 16. Mol Cell Endocrinol. 2013. PMID: 23084976 Free PMC article. Review.
References
-
- Franks S 1995 Polycystic ovary syndrome. N Engl J Med [Erratum (1996) 334:668] 333:853–861 - PubMed
-
- Knochenhauer ES, Key TJ, Kahsar-Miller M, Waggoner W, Boots LR, Azziz R 1998 Prevalence of the polycystic ovary syndrome in unselected black and white women of the southeastern United States: a prospective study. J Clin Endocrinol Metab 83:3078–3082 - PubMed
-
- Hoffman LK, Ehrmann DA 2008 Cardiometabolic features of polycystic ovary syndrome. Nat Clin Pract Endocrinol Metab 4:215–222 - PubMed
-
- Kousta E, Franks S 2007 Long-term health consequences of polycystic ovary syndrome. Kovacs G, Norman R, eds. Polycystic ovary syndrome. Cambridge, UK: Cambridge University Press
-
- Cho LW, Atkin SL 2007 Cardiovascular risk in women with polycystic ovary syndrome. Minerva Endocrinol 32:263–273 - PubMed
Publication types
MeSH terms
Substances
Grants and funding
LinkOut - more resources
Full Text Sources
Other Literature Sources
Medical
