. 2009 Mar;150(3):1235-49.
doi: 10.1210/en.2008-0563. Epub 2008 Oct 30.

Elucidating the role of gonadal hormones in sexually dimorphic gene coexpression networks

Affiliations

Elucidating the role of gonadal hormones in sexually dimorphic gene coexpression networks

Atila van Nas et al. Endocrinology. 2009 Mar.

Abstract

We previously used high-density expression arrays to interrogate a genetic cross between strains C3H/HeJ and C57BL/6J and observed thousands of differences in gene expression between sexes. We now report analyses of the molecular basis of these sex differences and of the effects of sex on gene expression networks. We analyzed liver gene expression of hormone-treated gonadectomized mice as well as XX male and XY female mice. Differences in gene expression resulted in large part from acute effects of gonadal hormones acting in adulthood, and the effects of sex chromosomes, apart from hormones, were modest. We also determined whether there are sex differences in the organization of gene expression networks in adipose, liver, skeletal muscle, and brain tissue. Although coexpression networks of highly correlated genes were largely conserved between sexes, some exhibited striking sex dependence. We observed strong body fat and lipid correlations with sex-specific modules in adipose and liver as well as a sexually dimorphic network enriched for genes affected by gonadal hormones. Finally, our analyses identified chromosomal loci regulating sexually dimorphic networks. This study indicates that gonadal hormones play a strong role in sex differences in gene expression. In addition, it results in the identification of sex-specific gene coexpression networks related to genetic and metabolic traits.


Figures
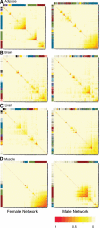
Figure 1
Figure 1
Topographical overlap matrix plot of genetic coexpression network in males and females. The x-axis and y-axis are modules of genes in the entire network and are identified as blocks of colors at the top or left, marking the rows and columns. The plot represents the degree of correlation of gene expression of each gene with all the other genes as indicated by the color bar where increasing color intensity depicts higher correlation (r). Thus, each row or column of this plot represents the connectivity strength of a single gene within the network, with increasing color intensity depicting higher connectivity (higher correlation with other gene’s expression pattern across animals). To visualize the degree of network preservation between males and females, the genes in the male modules were identified as the color of the genes in the female network. Modules were composed of genes with high topological overlap (similar patterns of correlated expression with other genes). The group of genes with low connectivity is colored beige. The plots show that genes within modules have high correlation of expression across mice, which appear as box-like clusters of high heat (high correlation). A, Adipose tissue; B, brain tissue; C, liver tissue; D, muscle tissue.
Figure 2
Figure 2
Differential expression and differential connectivity profiles between males and females. The difference between male and female connectivity was calculated by subtracting female connectivity (k) from male connectivity (k), and threshold for significance was determined by a permutation test (P values) (vertical lines). Differential gene expression was measured by Student’s t test, threshold for significance based on 5% FDR (q value) (horizontal lines). Differential connectivity is depicted on the x-axis, where male differential connectivity is on the left (negative) and female differential connectivity is on the right (positive). Differential expression is depicted on the y-axis, where male differential expression is on the top (positive) and female differential expression is on the bottom (negative). A, Adipose tissue; B, brain tissue; C, liver tissue; D, muscle tissue.
Figure 3
Figure 3
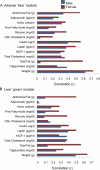
Network correlation with metabolic traits between male and female. We measured the correlation of each module with metabolic traits representing body fat, lipid, and atherosclerosis. The principal component of gene expression (pc) of each module was calculated and correlated to each of the metabolic traits. A, Adipose blue module; B, liver green module.
Figure 4
Figure 4
eQTL of the blue module in the adipose network and the cyan module in the liver network. The gene transcript abundance was used as a trait to detect QTL and the number of eQTL with a LOD of 3 or higher are plotted. The red curve indicates the eQTL count in the female network, and the blue curve indicates the eQTL count male network. The adipose blue module consisted of 1090 genes and the cyan consisted of 82 genes. A, Adipose blue module; B, liver cyan module.
Figure 5
Figure 5
Visualization of sex-specific differentially connected genes of the liver cyan module (Fig. 2, sector 1). These genes were also enriched for differentially expressed genes affected by DHT. Genes with 40 or more connections are identified by the larger nodes as seen primarily in the male network, and genes with fewer than 40 connections are identified by the smaller nodes as seen primarily in the female network.

Comment in

  • Do these genes make me look fat?
    Perrot-Sinal TS. Perrot-Sinal TS. Endocrinology. 2009 Mar;150(3):1075-7. doi: 10.1210/en.2008-1586. Endocrinology. 2009. PMID: 19240263 No abstract available.

Similar articles

Cited by

References

    1. Wizemann TM, Pardue M, eds 2001 Exploring the biological contributions to human health: does sex matter? Washington, DC: National Academies Press - PubMed
    1. Mendelsohn ME, Karas RH 2005 Molecular and cellular basis of cardiovascular gender differences. Science 308:1583–1587 - PubMed
    1. Blaak E 2001 Gender differences in fat metabolism. Curr Opin Clin Nutr Metab Care 4:499–502 - PubMed
    1. Mittendorfer B 2005 Sexual dimorphism in human lipid metabolism. J Nutr 135:681–686 - PubMed
    1. Arnold AP 2002 Concepts of genetic and hormonal induction of vertebrate sexual differentiation in the twentieth century, with special reference to the brain. In: Pfaff DW, Arnold AP, Etgen AM, Fahrbach SE, Moss RL, Rubin RT, eds. Hormones, brain, and behavior. San Diego: Academic Press; 105–135

Publication types