

Semaphorin 3E expression correlates inversely with Plexin D1 during tumor progression
- PMID: 18974298
- PMCID: PMC2626397
- DOI: 10.2353/ajpath.2008.080136
Semaphorin 3E expression correlates inversely with Plexin D1 during tumor progression
Abstract
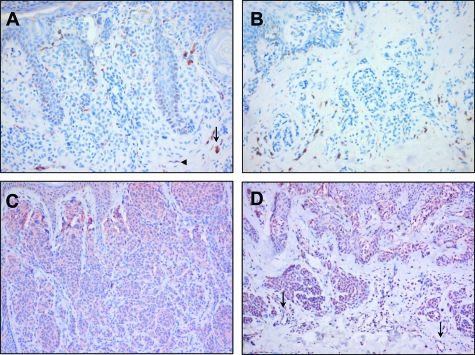
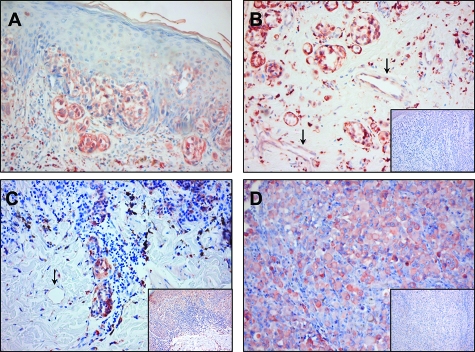
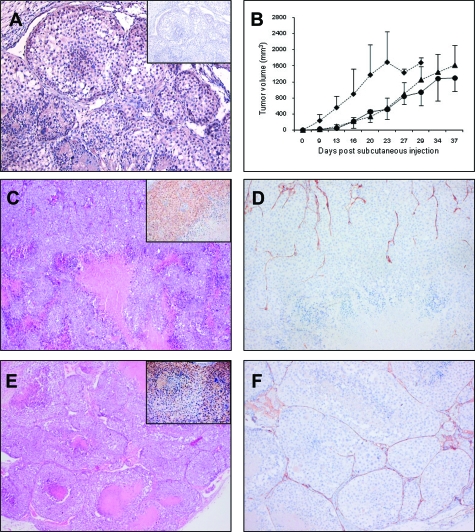
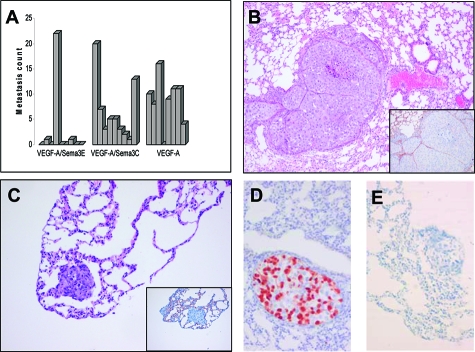
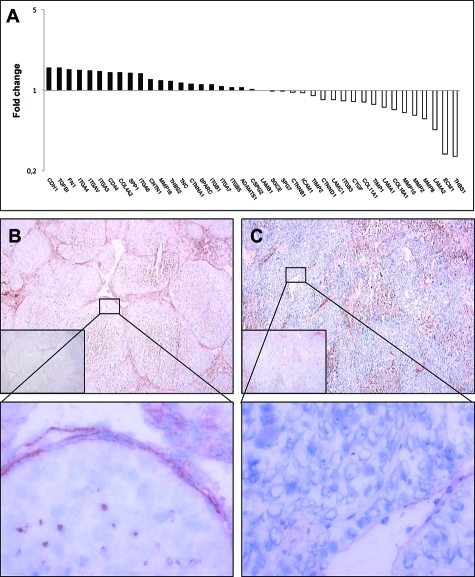
Plexin D1 (PLXND1) is broadly expressed on tumor vessels and tumor cells in a number of different human tumor types. Little is known, however, about the potential functional contribution of PLXND1 expression to tumor development. Expression of semaphorin 3E (Sema3E), one of the ligands for PLXND1, has previously been correlated with invasive behavior and metastasis, suggesting that the PLXND1-Sema3E interaction may play a role in tumor progression. Here we investigated PLXND1 and Sema3E expression during tumor progression in cases of melanoma. PLXND1 was not expressed by melanocytic cells in either naevi or melanomas in situ, whereas expression increased with invasion level, according to Clark's criteria. Furthermore, 89% of the metastatic melanomas examined showed membranous PLXND1-staining of tumor cells. Surprisingly, expression of Sema3E was inversely correlated with tumor progression, with no detectable staining in melanoma metastasis. To functionally assess the effects of Sema3E expression on tumor development, we overexpressed Sema3E in a xenograft model of metastatic melanoma. Sema3E expression dramatically decreased metastatic potential. These results show that PLXND1 expression during tumor development is strongly correlated with both invasive behavior and metastasis, but exclude Sema3E as an activating ligand.
Figures
Similar articles
-
Divergent roles of Plexin D1 in cancer.Biochim Biophys Acta Rev Cancer. 2019 Aug;1872(1):103-110. doi: 10.1016/j.bbcan.2019.05.004. Epub 2019 May 30. Biochim Biophys Acta Rev Cancer. 2019. PMID: 31152824 Free PMC article. Review.
-
Enhanced expression of semaphorin 3E is involved in the gastric cancer development.Int J Oncol. 2016 Sep;49(3):887-94. doi: 10.3892/ijo.2016.3593. Epub 2016 Jun 30. Int J Oncol. 2016. PMID: 27572291 Free PMC article.
-
Inhibition of semaphorin as a novel strategy for therapeutic angiogenesis.Circ Res. 2010 Feb 5;106(2):391-8. doi: 10.1161/CIRCRESAHA.109.210815. Epub 2009 Nov 25. Circ Res. 2010. PMID: 19940264
-
Vascular Sema3E-Plexin-D1 Signaling Reactivation Promotes Post-stroke Recovery through VEGF Downregulation in Mice.Transl Stroke Res. 2022 Feb;13(1):142-159. doi: 10.1007/s12975-021-00914-4. Epub 2021 May 12. Transl Stroke Res. 2022. PMID: 33978913 Free PMC article.
-
The role and mechanism-of-action of Sema3E and Plexin-D1 in vascular and neural development.Semin Cell Dev Biol. 2013 Mar;24(3):156-62. doi: 10.1016/j.semcdb.2012.12.001. Epub 2012 Dec 25. Semin Cell Dev Biol. 2013. PMID: 23270617 Free PMC article. Review.
Cited by
-
The extracellular SEMA domain attenuates intracellular apoptotic signaling of semaphorin 6A in lung cancer cells.Oncogenesis. 2018 Dec 5;7(12):95. doi: 10.1038/s41389-018-0105-z. Oncogenesis. 2018. PMID: 30518871 Free PMC article.
-
Molecular impact of selective NFKB1 and NFKB2 signaling on DLBCL phenotype.Oncogene. 2017 Jul 20;36(29):4224-4232. doi: 10.1038/onc.2017.90. Epub 2017 Apr 3. Oncogene. 2017. PMID: 28368397
-
Divergent roles of Plexin D1 in cancer.Biochim Biophys Acta Rev Cancer. 2019 Aug;1872(1):103-110. doi: 10.1016/j.bbcan.2019.05.004. Epub 2019 May 30. Biochim Biophys Acta Rev Cancer. 2019. PMID: 31152824 Free PMC article. Review.
-
Class-3 Semaphorins and Their Receptors: Potent Multifunctional Modulators of Tumor Progression.Int J Mol Sci. 2019 Jan 28;20(3):556. doi: 10.3390/ijms20030556. Int J Mol Sci. 2019. PMID: 30696103 Free PMC article. Review.
-
Sema3E-Plexin D1 signaling drives human cancer cell invasiveness and metastatic spreading in mice.J Clin Invest. 2010 Aug;120(8):2684-98. doi: 10.1172/JCI42118. Epub 2010 Jul 26. J Clin Invest. 2010. PMID: 20664171 Free PMC article.
References
-
- Elder DE. Pathology of melanoma. Clin Cancer Res. 2006;12:2308s–2311s. - PubMed
-
- Guerry D, Synnestvedt M, Elder DE, Schultz D. Lessons from tumor progression: the invasive radial growth phase of melanoma is common, incapable of metastasis, and indolent. J Invest Dermatol. 1993;100:342S–345S. - PubMed
-
- Barnhill RL, Fandrey K, Levy MA, Mihm MC, Jr, Hyman B. Angiogenesis and tumor progression of melanoma. Quantification of vascularity in melanocytic nevi and cutaneous malignant melanoma. Lab Invest. 1992;67:331–337. - PubMed
-
- Erhard H, Rietveld FJ, van Altena MC, Brocker EB, Ruiter DJ, de Waal RM. Transition of horizontal to vertical growth phase melanoma is accompanied by induction of vascular endothelial growth factor expression and angiogenesis. Melanoma Res. 1997;7 Suppl 2:S19–S26. - PubMed
-
- Clark WH, From L, Bernardino EA, Mihm MC. The histogenesis and biologic behavior of primary human malignant melanomas of the skin. Cancer Res. 1969;29:705–727. - PubMed
Publication types
MeSH terms
Substances
LinkOut - more resources
Full Text Sources
Other Literature Sources
Medical
Miscellaneous
