. 2008 Dec;173(6):1595-608.
doi: 10.2353/ajpath.2008.080414. Epub 2008 Oct 30.

Membrane protected apoptotic trophoblast microparticles contain nucleic acids: relevance to preeclampsia

Affiliations

Membrane protected apoptotic trophoblast microparticles contain nucleic acids: relevance to preeclampsia

Aaron F Orozco et al. Am J Pathol. 2008 Dec.

Abstract

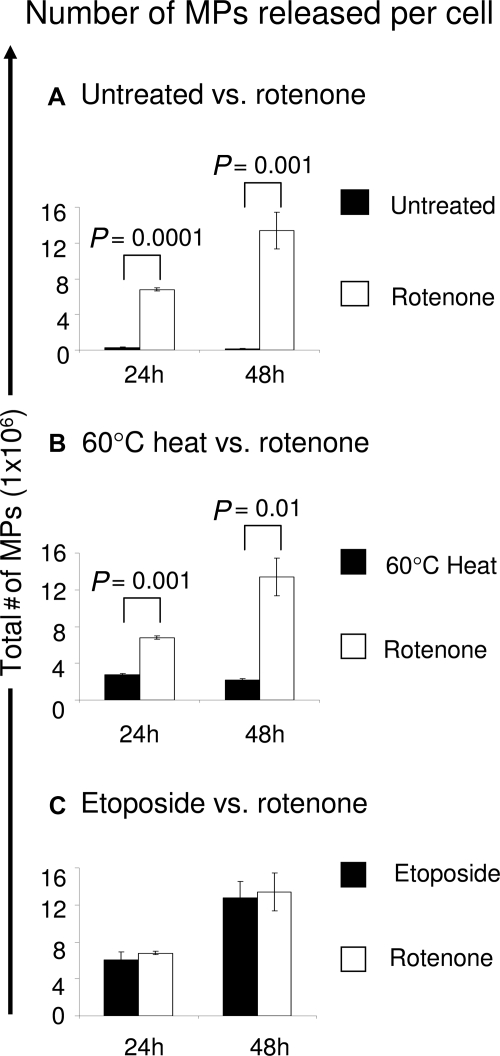
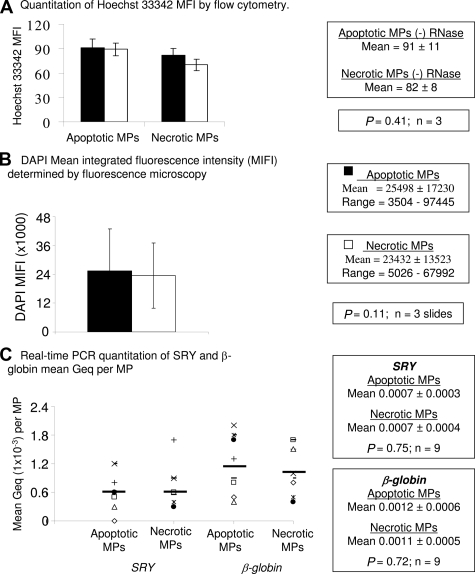
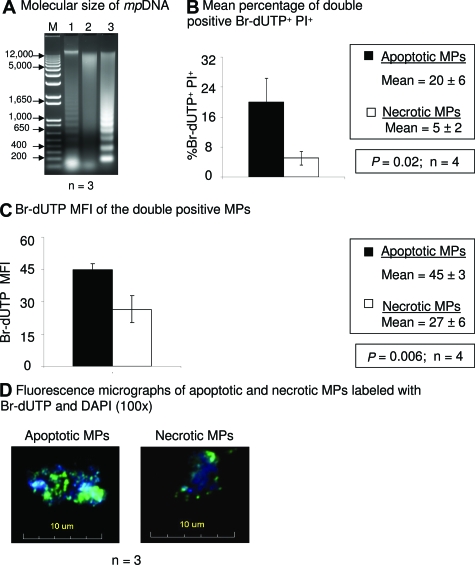
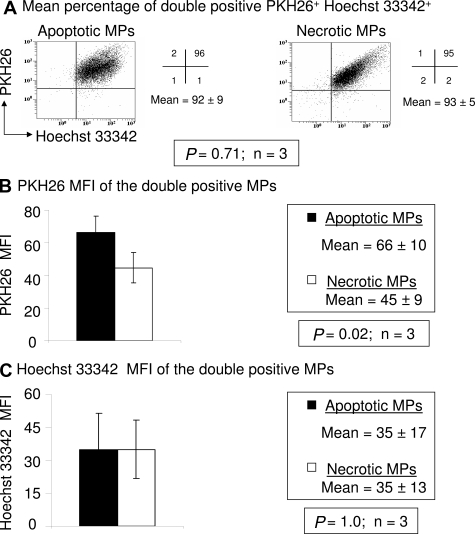
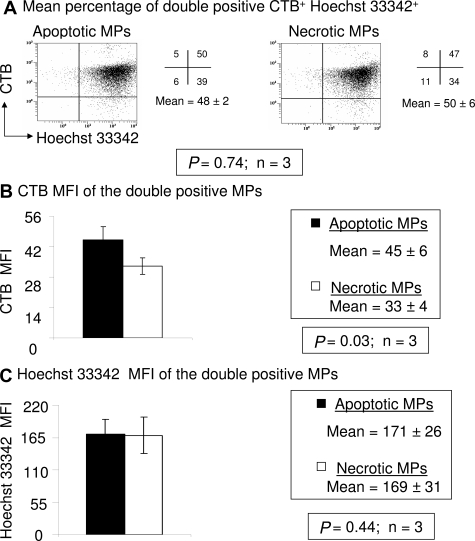
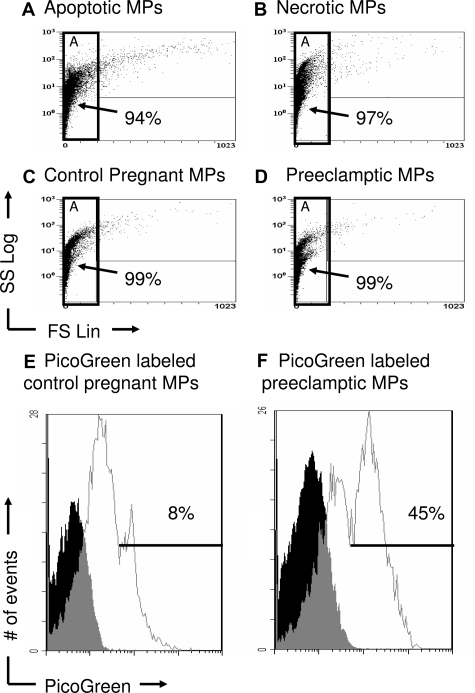
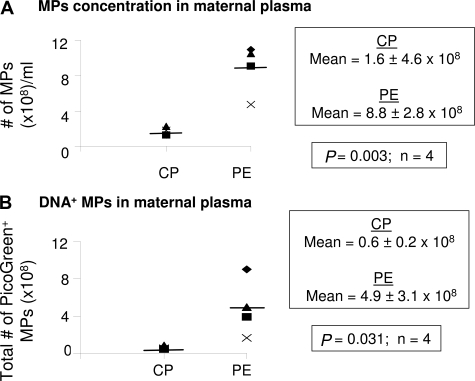
Microparticles (MPs) that circulate in blood may be a source of DNA for molecular analyses, including prenatal genetic diagnoses. Because MPs are heterogeneous in nature, however, further characterization is important before use in clinical settings. One key question is whether DNA is either bound to aggregates of blood proteins and lipid micelles or intrinsically associated with MPs from dying cells. To test the latter hypothesis, we asked whether MPs derived in vitro from dying cells were similar to those in maternal plasma. JEG-3 cells model extravillous trophoblasts, which predominate during the first trimester of pregnancy when prenatal diagnosis is most relevant. MPs were derived from apoptosis and increased over 48 hours. Compared with necrotic MPs, DNA in apoptotic MPs was more fragmented and resistant to plasma DNases. Membrane-specific dyes indicated that apoptotic MPs had more membranous material, which protects nucleic acids, including RNA. Flow cytometry showed that MPs derived from dying cells displayed light scatter and DNA staining similar to MPs found in maternal plasma. Quantification of maternal MPs using characteristics defined by MPs generated in vitro revealed a significant increase of DNA(+) MPs in the plasma of women with preeclampsia compared with plasma from women with normal pregnancies. Apoptotic MPs are therefore a likely source of stable DNA that could be enriched for both early genetic diagnosis and monitoring of pathological pregnancies.


Figures

Figure 1
Figure 1
Cell death induction. Loss of DNA in apoptotic cells is reflected by the progressive increase of cells in the sub-G1 region. After induction of apoptosis by etoposide (30 μg/ml), rotenone (50 μg/ml), or necrosis with heat (60°C, 1 hour), cells were permeabilized with 70% ethanol and labeled with propidium iodide (PI) containing RNase A and analyzed the percentage of cells containing subdiploid DNA (% Sub G1) quantified by flow cytometry. The histograms show cell cycle data from one representative experiment of (A) untreated, (B) etoposide-, (C) rotenone-, and (D) 60°C heat- treated cells. The brackets within the histogram indicate the percentage of cells with subdiploid DNA. E: The bar graph shows the percent sub-G1+ cells of each treatment from three independent experiments and statistical significance (P value) was calculated by Student’s t-test. Standard deviations are indicated. PI uptake. Cells were labeled with PI without fixation and the change in light scatter and PI uptake measured by flow cytometry. The dot plots show PI uptake from one representative experiment of (F) untreated, (G) etoposide-, (H) rotenone-, and (I) 60°C heat- treated cells. PI+ cells are back-gated onto the light scatter and shown in red. J: The bar graph shows the mean PI uptake (± SD) of each treatment from three independent experiments and statistical significance (P value) was calculated by Student’s t-test.
Figure 2
Figure 2
Quantitation of cell death-induced MPs. JEG-3 cells were left untreated or treated with etoposide, rotenone, or 60°C heat and incubated for 24 and 48 hours at 37°C. Supernatants were collected and detached cells were pelleted (300 × g), followed by additional 800 × g centrifugation. MPs were quantitated as described in Materials and Methods. The total amount of cell-free MPs (y axis) released into the media were measured at 24 and 48 hours (x axis) by flow cytometry using a fluorescent bead assay. Number of MPs released over time. The bar graph compares the number of MPs found in the supernatant between rotenone-treated cells (A, B, C) and (A) untreated cells (B) 60°C heat- and (C) etoposide-treated cells. The results (mean ± SD) are from three independent experiments.
Figure 3
Figure 3
Comparison of mpDNA content. Supernatants containing MPs were centrifuged at 300 × g to remove cells. The MPs were centrifuged again at 800 × g, followed by a final 25,000 × g centrifugation. A: Quantitation of Hoechst 33342 MFI by flow cytometry. MPs were treated with and without RNase A (1 mg/ml) and labeled with Hoechst 33342 (10 μg/μl). The results are Hoechst 33342 fluorescence as indicated by the MFI ± SD A total of 10,000 events were obtained for each experiment (n = 3). B: Amount of DAPI MIFI. MPs were labeled with DAPI and analyzed by an autoscanning fluorescence microscopy. One hundred MPs per slide per experiment were counted. The results are presented as the DAPI MIFI per MP ± SD for three independent experiments. C: SRY and β–globin DNA concentration per MP. DNA amplified for SRY and β–globin from apoptotic and necrotic MPs are indicated on the x axis. DNA concentrations are in Geq/MP and are plotted on the y axis (n = 9). The bars represent the mean value.
Figure 4
Figure 4
Molecular form of mpDNA. DNA fragmentation was demonstrated by the DNA ladder assay. Rotenone-induced and 60°C HS MPs were isolated from cell-free supernatants by two centrifugation steps (300 × g and 800 × g). After a final centrifugation (25,000 × g), mpDNA was purified by phenol/chloroform extraction and analyzed on a 2% agarose gel stained with ethidium bromide. A: Lane M, 1kb DNA size marker; lane 1, positive control apoptotic cells; lane 2, DNA from necrotic MPs; lane 3, DNA from apoptotic MPs. Results are representative of three independent experiments. TUNEL assay. Nicked mpDNA was detected by the TUNEL assay. MPs were isolated as mentioned above. The MPs were labeled with Br-dUTP and counterstained with PI for flow cytometric analysis or counterstained with DAPI II and analyzed by fluorescence microscopy. Flow cytometry. A total of 10,000 events were obtained in each of four independent experiments and the results reported as the mean ± SD B: The bar graph represents the percentage of Br-dUTP+ PI+ double positive apoptotic and necrotic MPs (n = 4). C: The bar graph represents the MFI of Br-dUTP from double positive (Br-dUTP versus PI) MPs (n = 4). Fluorescence microscopy. D: Br-dUTP labeled MPs (green) were fixed onto a slide with 100% methanol, counterstained with DAPI II (blue) and analyzed by fluorescence microscopy. Micrographs are representative of three independent experiments.
Figure 5
Figure 5
Apoptotic MPs have more lipid membranes than necrotic MPs. A: Dot plots of apoptotic and necrotic MPs double stained for PKH26 (membrane dye) and Hoechst 33342 (DNA dye). The numbers shown in each quadrant are the percentage of the total population of MPs within each quadrant. A total of 10,000 events were obtained for each of three independent experiments and results reported as the mean ± SD of PKH26+ Hoechst 33342+ MPs. B: The bar graph represents the mean fluorescence intensity (MFI) of PKH26 from double positive (PKH26 vs. Hoechst 33342) MPs (n = 3). C: The bar graph represents the MFI of Hoechst 33342 from double positive (PKH26 vs. Hoechst 33342) MPs (n = 3).
Figure 6
Figure 6
More cholera toxin B binding in apoptotic MPs. A: Dot plots of apoptotic MPs and necrotic MPs stained with CTB and Hoechst 33342. The numbers shown in each quadrant are the percentage of the total population of MPs within each quadrant. A total of 10,000 events were obtained in each of the three independent experiments and the results reported as the mean ± SD of CTB+ Hoechst 33342+ MPs. B: The bar graph represents the mean fluorescence intensity (MFI) of CTB from double positive (CTB versus Hoechst 33342) MPs (n = 3). C: The bar graph represents the MFI of Hoechst 33342 from double positive (CTB versus Hoechst 33342) MPs (n = 3).
Figure 7
Figure 7
Apoptotic MPs are more resistant to DNase activity in the plasma. A: MPs spiked into female plasma. Isolated MPs were resuspended in female plasma at two different temperatures, 0°C and 37°C, for 24 hours. In addition, naked male GDNA (JEG-3 cells) was spiked into female plasma under the same conditions. The SRY gene (Y chromosome) was amplified (193 bp fragment) and analyzed on a 1% agarose gel. The ethidium bromide band intensities were quantitated and the DNA concentrations were extrapolated using a PCR amplified standard curve (as described in Methods and Materials). The statistical significance of quantification was assessed using paired Student’s t-test (P < 0.05) and expressed in terms of the ratio of amount of DNA protected (37°C/0°C) for three independent experiments. B: DNase sensitivity assay. Isolated apoptotic and necrotic MPs labeled with membrane dye, PKH26 (red), incubated with and without DNase I for 20 minutes at 37°C and counterstained with and DNA dye, DAPI (blue). Micrographs are representative of three independent experiments.
Figure 8
Figure 8
MPs from maternal plasma display light scatter properties similar to in vitro MPs. In vitro MPs were centrifuged at 300 × g to remove cells, followed by a second 800 × g centrifugation. The MP supernatants were then centrifuged at 25,000 × g and resuspended in PBS. Frozen plasma samples were thawed, resuspended in PBS and labeled with or without PicoGreen. The light scatter properties of in vitro and plasma MPs were then compared by flow cytometry and displayed as dot plots (x axis, size; y axis, subcellular content). A: In vitro apoptotic MPs were resuspended in PBS and shown in Gate A. B: In vitro necrotic MPs were resuspended in PBS and shown in Gate A. C: Control maternal plasma samples were resuspended in PBS and shown in Gate A. D: Preeclamptic plasma samples were resuspended in PBS and shown in Gate A. (E, F) The PicoGreen negative peak is the autofluorescence of unstained MPs. The intermediate peak is heterogeneous containing MPs with intermediate amounts DNA, the bright PicoGreen peak has high levels of DNA. Histograms are representative of four independent experiments.
Figure 9
Figure 9
Quantitation of circulating mpDNA in normal pregnancy and preeclampsia. Frozen plasma samples were thawed and the concentration of MPs (# of MPs/ml) was quantitated by flow cytometry using a fluorescent bead assay as described in Materials and Methods. A: The scattergram compares the concentration of circulating MPs (MPs/ml) between control pregnant (CP) and preeclamptic (PE) women. The results are reported as the mean ± SD (n = 4). B: MPs labeled with PicoGreen (DNA binding dye) were analyzed by flow cytometry. A total of 10,000 events were counted for each of eight samples. The total number of PicoGreen+ MPs was obtained by multiplying the total number of MPs by the percentage of PicoGreen+ MPs in CP and PE women. The results are reported as the mean ± SD (n = 4). The bars represent the mean value.

Similar articles

Cited by

References

    1. Simak J, Gelderman MP. Cell Membrane Microparticles in Blood and Blood Products: potentially Pathogenic Agents and Diagnostic Markers. Transfus Med Rev. 2006;20:1–26. - PubMed
    1. Redman CW, Sargent IL. Microparticles and Immunomodulation in Pregnancy and Pre-Eclampsia. J Reprod Immunol. 2007;76:61–67. - PubMed
    1. Toth B, Lok CA, Boing A, Diamant M, van der Post JA, Friese K, Nieuwland R. Microparticles and Exosomes: impact on Normal and Complicated Pregnancy. Am J Reprod Immunol. 2007;58:389–402. - PubMed
    1. Thery C, Boussac M, Veron P, Ricciardi-Castagnoli P, Raposo G, Garin J, Amigorena S. Proteomic Analysis of Dendritic Cell-Derived Exosomes: a Secreted Subcellular Compartment Distinct from Apoptotic Vesicles. J Immunol. 2001;166:7309–7318. - PubMed
    1. Schiller M, Bekeredjian-Ding I, Heyder P, Blank N, Ho AD, Lorenz HM. Autoantigens Are Translocated into Small Apoptotic Bodies During Early Stages of Apoptosis. Cell Death Differ. 2008;15:183–191. - PubMed

Publication types