. 2008 Dec;173(6):1657-68.
doi: 10.2353/ajpath.2008.080337. Epub 2008 Oct 30.

Immunological mechanisms underlying the genetic predisposition to severe Staphylococcus aureus infection in the mouse model

Affiliations

Immunological mechanisms underlying the genetic predisposition to severe Staphylococcus aureus infection in the mouse model

Maren von Köckritz-Blickwede et al. Am J Pathol. 2008 Dec.

Abstract

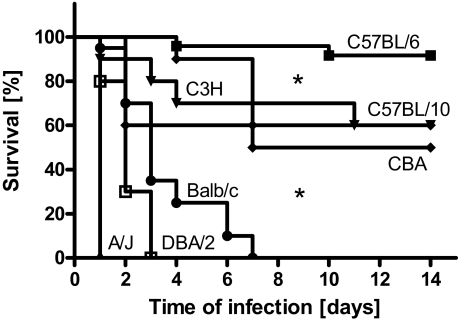
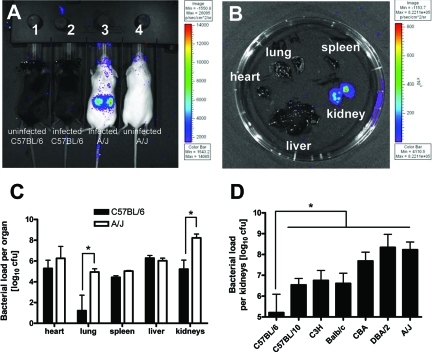
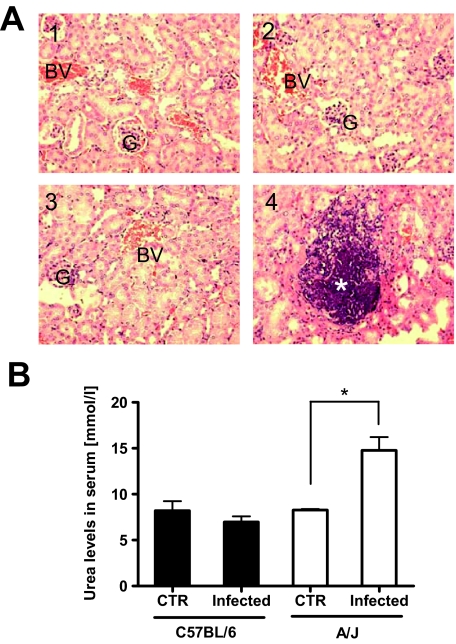
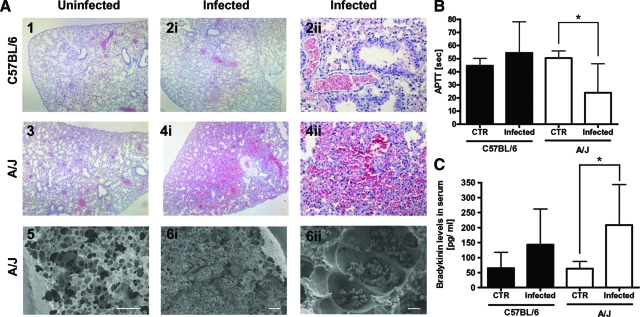
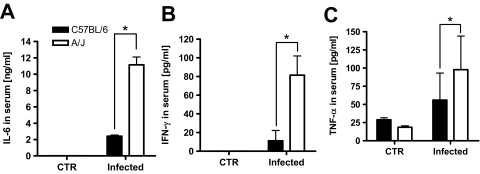
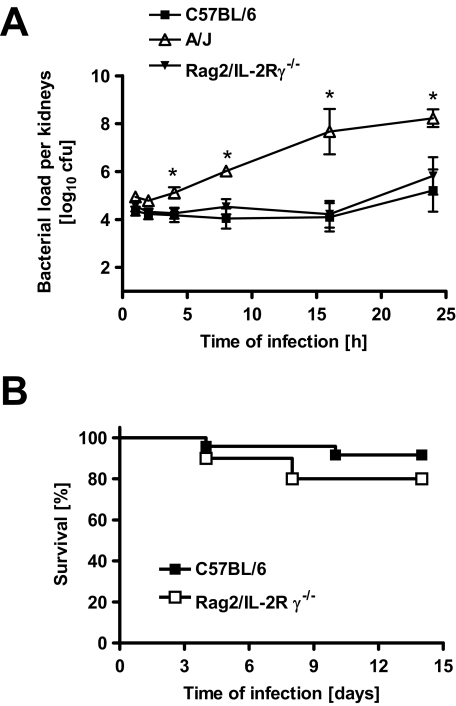
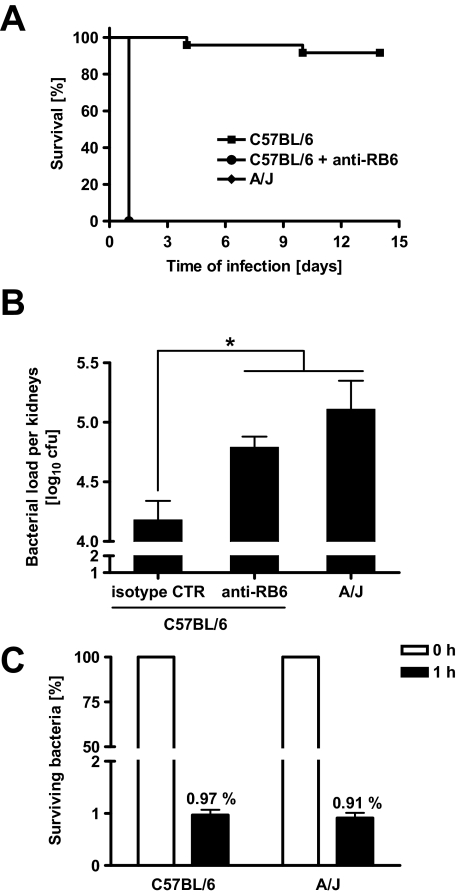
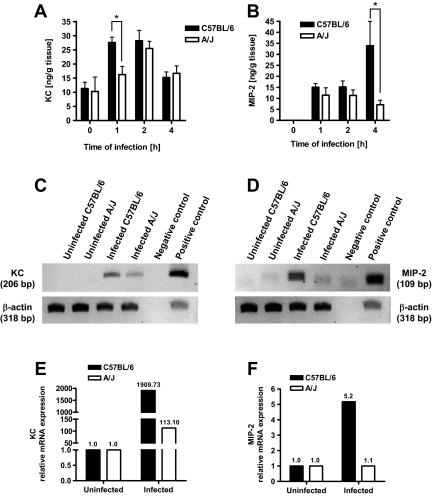
Host genetic variations play a significant role in conferring predisposition to infection. In this study, we examined the immune mechanisms underlying the host genetic predisposition to severe Staphylococcus aureus infection in different mouse strains. Whereas C57BL/6 mice were the most resistant in terms of control of bacterial growth and survival, A/J, DBA/2, and BALB/c mice were highly susceptible and succumbed to infection shortly after bacterial inoculation. Other strains (C3H/HeN, CBA, and C57BL/10) exhibited intermediate susceptibility levels. Susceptibility of mice to S. aureus was associated with an inability to limit bacterial growth in the kidneys and development of pathology. Resistance to S. aureus in C57BL/6 mice was dependent on innate immune mechanisms because Rag2-IL2Rgamma(-/-) C57BL/6 mice, which are deficient in B, T, and NK cells, were also resistant to infection. Indeed, neutrophil depletion or inhibition of neutrophil recruitment rendered C57BL/6 mice completely susceptible to S. aureus, indicating that neutrophils are essential for the observed resistance. Although neutrophil function is not inhibited in A/J mice, expression of neutrophil chemoattractants KC and MIP-2 peaked earlier in the kidneys of C57BL/6 mice than in A/J mice, indicating that a delay in neutrophil recruitment to the site of infection may underlie the increased susceptibility of A/J mice to S. aureus.


Figures

Figure 1
Figure 1
Survival of C57BL/6, C57BL/10, C3H/HeN, CBA, BALB/c, DBA/2, and A/J mice after intravenous infection with 4 × 10⁷ cfu of S. aureus strain SH1000. Each group contained a minimum of 10 mice. Comparison of survival curves was performed by use of log rank test. *P < 0.05.
Figure 2
Figure 2
A: Bacterial loads in resistant C57BL/6 (mouse 2) and susceptible A/J mice (mouse 3) infected for 24 hours with bioluminescent S. aureus strain SH1000 ALC2906. Uninfected C57BL/6 (mouse 1) and A/J (mouse 4) were used for comparison. B: Bacterial loads in systemic organs (heart, lung, spleen, kidney, or liver) isolated from a susceptible A/J mouse at 24 hours after bacterial inoculation. Visualization of luminescent bacteria was performed using the Xenogen Vivo Vision IVIS 200 system. C: Bacterial loads in systemic organs of C57BL/6 and A/J mice at 24 hours after intravenous infection with 4 × 10⁷ cfu of S. aureus SH1000 determined after serial plating of the organ’s homogenates. D: Bacterial loads in kidneys of C57BL/6, C57BL/10, C3H/HeN, BALB/c, CBA, DBA/2, and A/J mice at 24 hours after intravenous infection with 4 × 10⁷ cfu of S. aureus SH1000 determined after serial plating. Bars represent the mean ± SD of five mice per group. *P < 0.05, by F-test.
Figure 3
Figure 3
A: Representative H&E-stained kidney sections collected from uninfected (A1, A3) or S. aureus-infected (A2, A4) C57BL/6 (A1, A2) or A/J (A3, A4) mice at 24 hours of infection with S. aureus. Glomeruli are indicated by G, blood vessels by BV, and bacteria by a white asterisk. B: Levels of urea in serum of infected or uninfected C57BL/6 (black bars) or A/J (white bars) mice at 24 hours of infection with S. aureus. *P < 0.05, by F-test. Original magnifications, × 200.
Figure 4
Figure 4
A: Representative light micrograph (H&E-stained) (A1 to A4) and scanning electron micrograph (A5 and A6) of lung tissue sections of uninfected (left) or S. aureus-infected (middle and right) C57BL/6 and A/J mice. The lungs of infected C57BL/6 mice were unaffected (A2) and show similar alveolar architecture as lung tissue from uninfected mice (A1, A3). Widespread hemorrhages and massive erythrocyte infiltration of lung parenchyma and bronchioles were observed in lung sections of S. aureus-infected A/J mice (A4, A6). B: Activated partial thromboplastin time (aPTT) in plasma. C: Bradykinin release in serum of C57BL/6 (black bars) and A/J (white bars) mice at 24 hours after intravenous infection with 4 × 10⁷ cfu S. aureus. Bars represent the mean ± SD of five mice per group. *P < 0.05, by F-test. Scale bars: 100 μm (A5, A6i); 10 μm (A6ii). Original magnifications: × 40 (A1, A2i, A3, A4i); × 200 (A2ii, A4ii).
Figure 5
Figure 5
Levels of IL-6 (A), interferon-γ (B), and tumor necrosis factor-α (C) in serum of uninfected or infected C57BL/6 (black bars) and A/J mice (white bars) at 24 hours of infection with 4 × 10⁷ cfu of S. aureus. Bars represent the mean ± SD of three mice per group. *P < 0.05, by F-test.
Figure 6
Figure 6
A: Kinetics of bacterial growth in the kidneys of C57BL/6, Rag2/IL-2Rγ−/− C57BL/6, and A/J mice after intravenous infection with S. aureus. Each point represents the mean ± SD of five mice per group. *P < 0.05, by F-test. B: Survival times of immunocompetent C57BL/6 and Rag2/IL-2Rγ−/− C57BL/6 mice after intravenous infection with 4 × 10⁷ cfu S. aureus. Each group contained a minimum of 10 mice. Comparison of survival curves was performed by use of log rank test. *P < 0.05.
Figure 7
Figure 7
A: Survival times of susceptible A/J mice, neutropenic C57BL/6 mice that were treated intravenously with anti-RB6 antibodies (100 μg, 1 day before infection) to deplete neutrophils, and immunocompetent C57BL/6 mice after intravenous infection with 4 × 10⁷ cfu of S. aureus. B: Bacteria loads in kidneys of susceptible A/J mice, neutropenic C57BL/6 mice, and immunocompetent isotype control-treated C57BL/6 mice at 4h after intravenous infection with 4 × 10⁷ cfu of S. aureus. Bars represent the mean ± SD of five mice per group. C: Capacity of neutrophils isolated from A/J or C57BL/6 mice to kill S. aureus. Carrageenan-treated mice were intraperitoneally infected with 4 × 10⁷ cfu of S. aureus SH1000 for 1 hour. Peritoneal neutrophils were collected, resuspended in Dulbecco’s modified Eagle’s medium supplemented with 10% fetal calf serum and 100 μg/ml of gentamicin to kill all extracellular bacteria, and further incubated for 2 hours at 37°C and 5% CO2. At 0 (100%) and 1 hour thereafter, neutrophils were disrupted with sterile water to release and quantify intracellular surviving bacteria. Bars represent the mean ± SD of three individual mice. *P < 0.05.
Figure 8
Figure 8
Time course of KC (A) and MIP-2 (B) expression in kidney homogenates of uninfected or S. aureus-infected C57BL/6 (black bars) and A/J (white bars) mice after intravenous infection with 4 × 10⁷ cfu of S. aureus. Bars represent the mean ± SD of five mice per group. *P < 0.05, by F-test. C: Representative agarose gel of KC-transcript expression (top lane) compared to β-actin loading control (bottom lane) in uninfected or infected C57BL/6 and A/J mice at 1 hour of infection. Plasmids containing the sequences encoding KC or β-actin were used as positive controls. D: Representative agarose gel of MIP-2-transcript expression (top lane) compared to β-actin loading control (bottom lane) in uninfected or infected C57BL/6 and A/J mice at 4 hours of infection. Plasmids containing the sequences encoding MIP-2 or β-actin were used as positive controls. E: RT-PCR amplification of KC-cDNA from uninfected and S. aureus-infected (1 hour of infection) kidney tissue from C57BL/6 (black bars) and A/J mice (white bars). Results are expressed as fold-changes in the ratio of KC-RNA to housekeeping gene mRNA in S. aureus-infected compared to uninfected tissue. F: RT-PCR amplification of MIP-2-cDNA from uninfected and S. aureus-infected (4 hours of infection) kidney tissue from C57BL/6 (black bars) and A/J mice (white bars). Results are expressed as fold-changes in the ratio of MIP-2-RNA to housekeeping gene mRNA in S. aureus-infected compared to uninfected tissue.

References

    1. Chang FY. Staphylococcus aureus bacteremia and endocarditis. J Microbiol Immunol Infect. 2000;33:63–68. - PubMed
    1. Pittet D, Wenzel RP. Nosocomial bloodstream infections. Secular trends in rates, mortality, and contribution to total hospital deaths. Arch Intern Med. 1995;155:1177–1184. - PubMed
    1. Lautenschlager S, Herzog C, Zimmerli W. Course and outcome of bacteremia due to Staphylococcus aureus: evaluation of different clinical case definitions. Clin Infect Dis. 1993;16:567–573. - PubMed
    1. Bone R. How Gram-positive organisms cause sepsis. J Crit Care. 1993;8:51–59. - PubMed
    1. Tarkowski A, Wagner H. Arthritis and sepsis caused by Staphylococcus aureus: can the tissue injury be reduced by modulating the host’s immune system? Mol Med Today. 1998;4:15–18. - PubMed

Publication types

MeSH terms