. 2008 Dec;173(6):1669-81.
doi: 10.2353/ajpath.2008.080234. Epub 2008 Oct 30.

After injection into the striatum, in vitro-differentiated microglia- and bone marrow-derived dendritic cells can leave the central nervous system via the blood stream

Affiliations

After injection into the striatum, in vitro-differentiated microglia- and bone marrow-derived dendritic cells can leave the central nervous system via the blood stream

Sonja Hochmeister et al. Am J Pathol. 2008 Dec.

Abstract

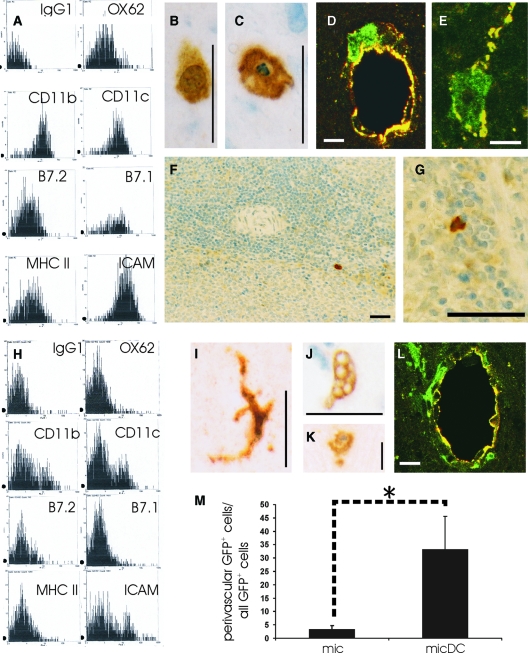
The prototypic migratory trail of tissue-resident dendritic cells (DCs) is via lymphatic drainage. Since the central nervous system (CNS) lacks classical lymphatic vessels, and antigens and cells injected into both the CNS and cerebrospinal fluid have been found in deep cervical lymph nodes, it was thought that CNS-derived DCs exclusively used the cerebrospinal fluid pathway to exit from tissues. It has become evident, however, that DCs found in peripheral organs can also leave tissues via the blood stream. To study whether DCs derived from microglia and bone marrow can also use this route of emigration from the CNS, we performed a series of experiments in which we injected genetically labeled DCs into the striata of rats. We show here that these cells migrated from the injection site to the perivascular space, integrated into the endothelial lining of the CNS vasculature, and were then present in the lumen of CNS blood vessels days after the injection. Moreover, we also found these cells in both mesenteric lymph nodes and spleens. Hence, microglia- and bone marrow-derived DCs can leave the CNS via the blood stream.


Figures

Figure 1
Figure 1
Characterization of micDCs. Microglial cultures were treated for 7 to 13 days with GM-CSF and IL-4. The non-adherent, free-floating cells were harvested and characterized according to morphological appearance (A), surface marker expression revealed by flow cytometry (B), ability to activate naïve T cells in mixed lymphocyte reactions (C), ability to take up antigens (D, E), transcription factor usage (F), expression of chemokines/cytokines (G), and response to activation by LPS. A: MicDCs have a round, irregular morphology with many dendrites and protrusions of variable length. B: Flow cytometric analysis of surface marker expression reveal the expression of costimulatory molecules (B7.1 and B7.2), the ICAM, and CD11b and CD11c. The expression of the OX62 antigen was inconsistent, ranging from a complete or near-complete absence (in 56%) to moderate (in 13%) to high levels (in 31% of all cultures). The high expression of surface MHC class II indicates that these micDCs are no longer immature. These data are representative of 28 independent cultures. C: MicDCs can activate naïve T cells, as demonstrated in mixed lymphocyte reactions where micDCs were derived from Lewis rats, and T cells from mesenteric lymph nodes of Sprague-Dawley rats. Different DC:T cell ratios were tested. The white box represents microglial cells harvested from mixed glial cultures, and the gray and black boxes represent two different cultures of micDCs. Counts per minute (cpm) ± standard deviations are shown. This experiment is representative of six independently derived micDCs preparations. D, E: Fluorescent microscopy or FACS images from micDCs (D) or microglial cells (E) treated with FITC-K12, FITC-BSA, and FITC-dextran at 4°C (to reveal nonspecific binding) and at 37°C (to show true uptake). Data are representative of several different experiments. F: Transcription factor profile of micDCs compared to microglial cells and bmDCs. MicDCs and bmDCs express PU.1 but not Spi-B and therefore resemble myeloid DCs. G: Pathway-focused rat inflammatory cytokines microarrays. mRNA from micDCs, bmDCs, and microglial cells (mic) were screened for the presence for transcripts encoding CCL17, CCL22, IL-12a, IL-12b. Glyceraldehyde-3-phosphate dehydrogenase (GAPDH) transcripts were used as a positive control. A PUC18 plasmid was used as a negative control. Please note that the greyish hue in the PUC18 sample results from a strong signal next to this probe. The data shown here are representative of two independently performed experiments. H: MicDCs in vitro are still able to respond to LPS and up-regulate the surface expression of B7.1, B7.2, ICAM-1, or MHC class II. Please note that we rarely observed an up-regulation of all markers, probably since we did not compare immature with mature DCs, but rather semimature with mature DCs. In 1/9 cultures analyzed, the most extreme case was observed, with an up-regulation of MHC-class II gene products together with CD11b, CD11c, B7.1, B7.2 and OX62 (shown in A). In other cultures, the response to LPS was much less pronounced, resulting in an up-regulation of CD11b and CD11c either alone (2/9 cultures) or together with B7.1 (2/9 cultures). B7.1 was up-regulated alone in 1/9 cultures. ICAM-1 was up-regulated together with OX62 (1/9 cultures), or with B7.1 and B7.2 (2/9 cultures). This indicates that the cells treated with LPS were already semimature. Bars = 25 μm (A, D) and 50 μm (E).
Figure 2
Figure 2
Combined in vivo and in vitro study to reveal the microglial origin of micDCs. A: Histological analysis of brain and spinal cord sections with anti-GFP antibodies. GFP+ bone marrow derived cells (dark) are seen in perivascular areas, but not in the parenchymal microglial cell pool. Scale bar = 50 μm. B: Percentages of GFP+ cells in the micDC population. Shown here are the mean values (± SD) of six different bone marrow chimeric rats. Note that the percentage of GFP cells in the micDC pool is much higher than the percentage of GFP cells in the pool of peripheral blood mononuclear cells (PBMNC) indicating that most of the GFP micDCs must derive from the GFP microglial cell pool. C: FACS-analysis of micDCs that had been derived from a mixed glial culture prepared from three GFP+ and three GFP pups. Note that similar amounts of GFP+ and GFP micDCs are present, which indicates that both cellular subsets grow equally well in culture. Data shown here are representative of two independently performed experiments.
Figure 3
Figure 3
Flow cytometric analysis of surface marker expression. BmDCs (A), microglial cells (B), and GFP+ micDCs (C) were analyzed. Both bmDCs and micDCs are characterized by a strong surface expression of MHC class II products and ICAM-1, which is not seen on microglial cells. These data are representative of five bmDC, five microglial, and two GFP+ micDC cultures.
Figure 4
Figure 4
MicDCs disperse from the injection site into the parenchyma and to the perivascular space. GFP+ micDCs were injected in a volume of 0.3 μl into the striatum of Lewis rats. Histological analyses were then made at different timepoints after the injection. A: Analysis of the location of GFP+ micDCs at different time points after the injection into the striatum. Three-micron serial sections through the striatum of three individual animals were made 24 hours, 3 days, and 6 days after the injection. Every 10th section was stained with anti-GFP antibodies, and the location of each GFP+ micDCs found within these sections was projected as a dot into the relevant scheme. Cells are found in the needle tract (small dots), in the parenchyma (black dots), and in the perivascular space (red dots). Please note that the injected cells disperse through the parenchyma (B, C), and that some of these cells undergo apoptosis (D). The parenchymal micDCs were often round (B, D), and had occasionally small processes (C). E: The ratio of the perivascular GFP+ cells/all GFP+ cells in the tissue increases over time. Shown here are the mean ratios ± SD after 1 and 3 days (10 animals per time point, pooled from three independently performed experiments). The difference between both groups is statistically significant at the 95% confidence interval (Mann Whitney W test, *P = 0.0058). F: Confocal microscopy reveals many MHC class II+ micDCs (OX-6 staining, green) in close vicinity to blood vessels (vWF staining, red). G–I: Stack of three confocal microscopy pictures, spaced 1 μm apart. This series of pictures shows the same MHC class II+ micDCs (OX-6, green), which directly contacts the lumen of a blood vessel (vWF, red) and which is integrated within the blood vessel endothelium. J: MicDCs (GFP, green) in the lumen of blood vessels (vWF, yellow). Scale bars = 50 μm (B), 25 μm (C, D) and 10 μm (F–J).
Figure 5
Figure 5
MicDCs in lymphoid organs. Three-micron thick serial sections of spleens (A) and mesenteric lymph nodes (B) isolated 3 days after the injection of micDCs into the striatum. The sections were stained with an anti-GFP antibody and searched for the presence of GFP+ micDCs. GFP+ micDCs appear brown. GFP+ micDCs were found in the spleen, at the border between white and red pulp (A), and in the medulla of mesenteric lymph nodes (B). To further substantiate these findings, we performed PCR analysis of spleens (S, pooled from four animals) and lymph nodes (L, pooled from four animals) together with ear-derived cDNA from a GFP+ Lewis rat as positive control (+) and omission of cDNA from the PCR reaction as negative control (−). The signal of the GFP products was very weak. We therefore made non-linear adjustments to make the PCR product visible on the picture, and to show that the GFP message was clearly detectable in spleens and lymph nodes (C). Scale bars = 100 μm.
Figure 6
Figure 6
The migratory behavior of bmDCs and microglia. Flow cytometric analysis of surface marker expression (A) of GFP+ bmDCs. The cells are characterized by a strong surface expression of MHC class II products and ICAM-1. GFP+ bmDCs were injected in a volume of 0.3 μl into the striatum of Lewis rats. Histological analyses were then made at different time points after the injection. The injected cells disperse through the parenchyma (B). Some of these cells undergo apoptosis (C). Confocal microscopy reveals GFP+ micDCs (green) in close vicinity to blood vessels (vWF staining, yellow; D) and also in the blood vessel lumen (E). We also found GFP+ bmDCs in the spleen, again at the border of the red/white pulp (F, G). Flow cytometric analysis of surface marker expression (H) of GFP+ microglial cells. The cells are characterized by an almost complete absence of surface MHC class II products and costimulatory molecules. GFP+ microglial cells were injected in a volume of 0.3 μl into the striatum of Lewis rats. Histological analyses were then made at different timepoints after the injection. The injected cells are able to acquire the typical ramified microglial morphology and are also seen in the parenchyma (I). Some of them engulf erythrocytes at the injection site (J). Also apoptotic GFP+ microglial cells can be found (K). Confocal microscopy revealed GFP+ micDCs (green) in close vicinity to blood vessels (vWF staining, yellow). An example of such a blood vessel is shown in (L). The ratio of perivascular GFP+ cells/all GFP+ cells in the tissue is lower in the group of injected microglial cells than in the case of the injected micDCs. Shown here are the mean ratios ± SD. M: For each group, data were pooled from days 1 and 3. Group sizes were n = 5 (mic) and n = 20 (mic DC). The difference between both groups is statistically significant at the 95% confidence interval (Mann Whitney W test, *P = 0.00077). Scale bars = 10 μm (D, E, L), 25 μm (B, C, I, J, K), and 50 μm (F, G).
Figure 7
Figure 7
T cell infiltration at the injection site. Histological staining using the W3/13 antibody to reveal T cells in the striatum, 1 (B, C) or 3 (A) days after the injection of micDCs (A), bmDCs (B), and microglial cells (C). T cells (W3/13+, dark) were seen at the injected site, close to the needle tract and within the parenchyma, but were absent from the contralateral unmanipulated site. Scale bars = 50 μm.
Figure 8
Figure 8
Interactions between dendritic cells and T cells at the injection site. Histological staining using the W3/13 antibody to reveal T cells (blue) in the striatum and the anti-GFP antibody to detect injected micDCs and bmDCs (brown). Shown here are intercellular contacts between micDCs and T cells (A, perivascular space, 3 days after the injection; C, parenchyma, 24 hours after the injection), and between bmDCs and T cells (B, parenchyma, 3 days after the injection).

Similar articles

Cited by

References

    1. McMenamin PG. Distribution and phenotype of dendritic cells and resident tissue macrophages in the dura mater, leptomeninges, and choroid plexus of the rat brain as demonstrated in wholemount preparations. J Comp Neurol. 1999;405:553–562. - PubMed
    1. McMenamin PG, Wealthall RJ, Deverall M, Cooper SJ, Griffin B. Macrophages and dendritic cells in the rat meninges and choroid plexus: three-dimensional localization by environmental scanning electron microscopy and confocal microscopy. Cell Tissue Res. 2003;313:259–269. - PubMed
    1. Kivisäkk P, Mahad DJ, Callahan MK, Sikora K, Trebst C, Tucky B, Wujek J, Ravid R, Staugaitis SM, Lassmann H, Ransohoff RM. Expression of CCR7 in multiple sclerosis: implications for CNS immunity. Ann Neurol. 2004;55:627–638. - PubMed
    1. Henkel JS, Engelhardt JI, Siklos L, Simpson EP, Kim SH, Pan T, Goodman JC, Siddique T, Beers DR, Appel SH. Presence of dendritic cells. MCP-1, and activated microglia/macrohages in amyotrophic lateral sclerosis spinal cord tissue. Ann Neurol. 2003;55:221–235. - PubMed
    1. Fischer HG, Bonifas U, Reichmann G. Phenotype and functions of brain dendritic cells emerging during chronic infection of mice with Toxoplasma gondii. J Immunol. 2000;164:4826–4834. - PubMed

Publication types

MeSH terms