. 2008 Nov;7(11):3480-9.
doi: 10.1158/1535-7163.MCT-08-0684. Epub 2008 Oct 30.

Quantitative live imaging of cancer and normal cells treated with Kinesin-5 inhibitors indicates significant differences in phenotypic responses and cell fate

Affiliations

Quantitative live imaging of cancer and normal cells treated with Kinesin-5 inhibitors indicates significant differences in phenotypic responses and cell fate

James D Orth et al. Mol Cancer Ther. 2008 Nov.

Abstract

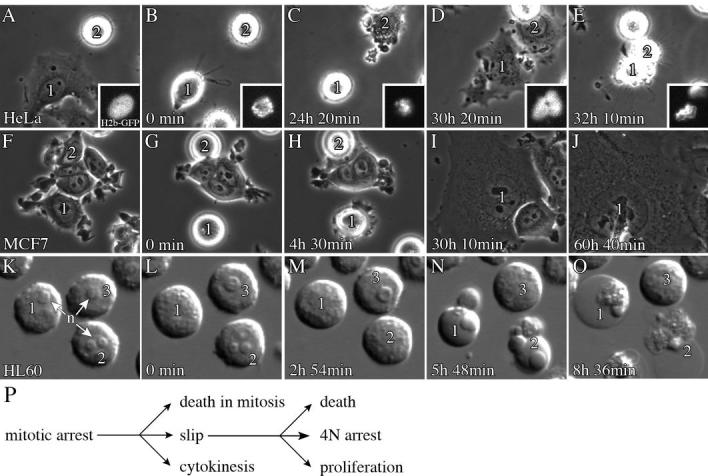
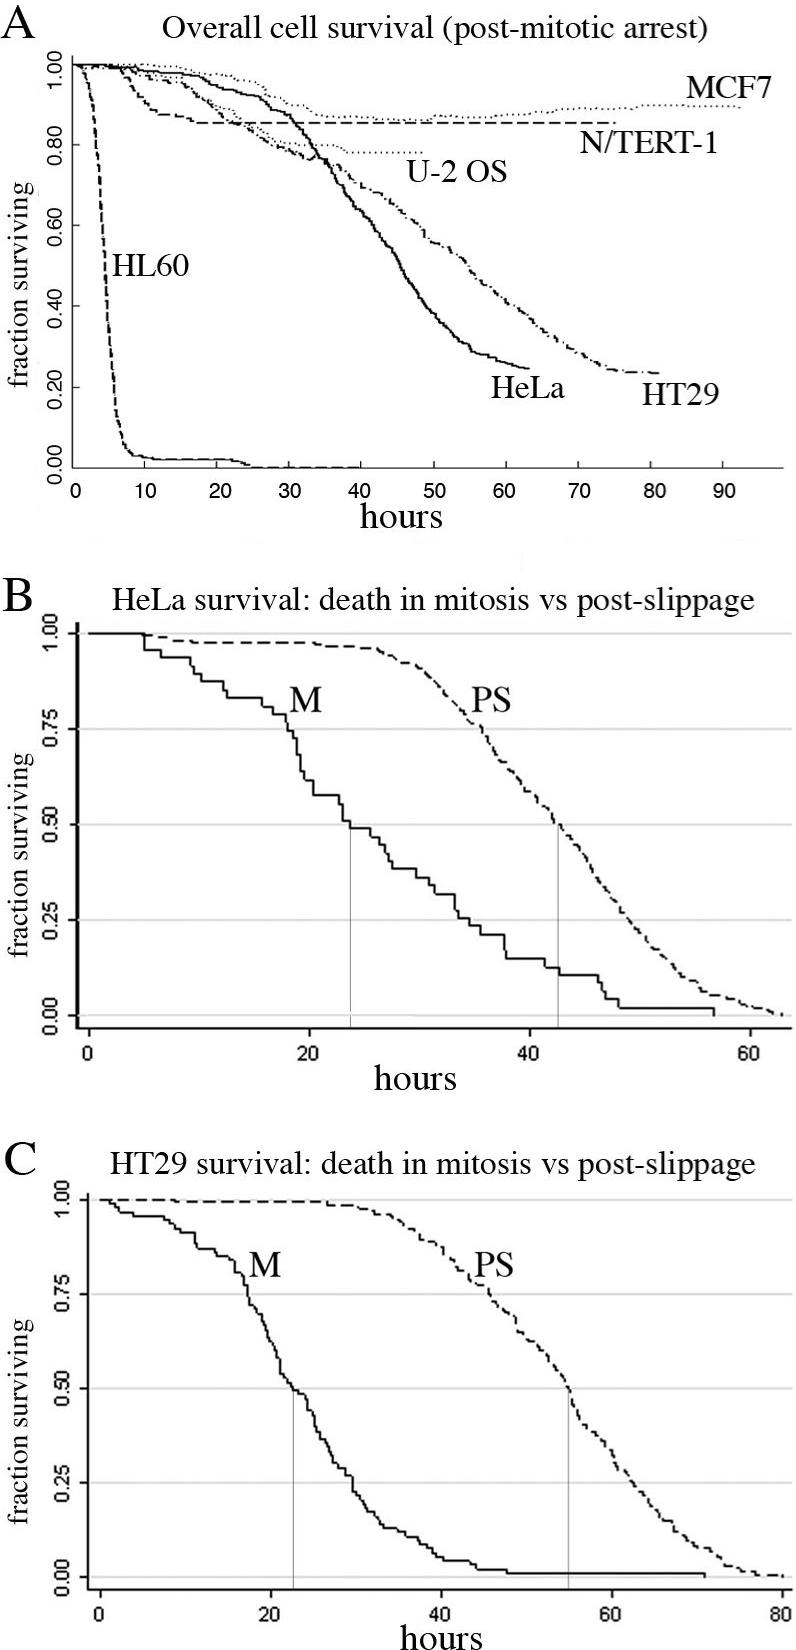
Kinesin-5 inhibitors (K5I) are promising antimitotic cancer drug candidates. They cause prolonged mitotic arrest and death of cancer cells, but their full range of phenotypic effects in different cell types has been unclear. Using time-lapse microscopy of cancer and normal cell lines, we find that a novel K5I causes several different cancer and noncancer cell types to undergo prolonged arrest in monopolar mitosis. Subsequent events, however, differed greatly between cell types. Normal diploid cells mostly slipped from mitosis and arrested in tetraploid G(1), with little cell death. Several cancer cell lines died either during mitotic arrest or following slippage. Contrary to prevailing views, mitotic slippage was not required for death, and the duration of mitotic arrest correlated poorly with the probability of death in most cell lines. We also assayed drug reversibility and long-term responses after transient drug exposure in MCF7 breast cancer cells. Although many cells divided after drug washout during mitosis, this treatment resulted in lower survival compared with washout after spontaneous slippage likely due to chromosome segregation errors in the cells that divided. Our analysis shows that K5Is cause cancer-selective cell killing, provides important kinetic information for understanding clinical responses, and elucidates mechanisms of drug sensitivity versus resistance at the level of phenotype.


Figures

Figure 1
Figure 1. EMD534085 and EMD596414 are potent K5Is, resulting in monopolar mitotic arrest
Control or K5I-treated U-2 OS cells were fixed and stained with antibodies against -tubulin and centrin. DNA was stained with Hoecsht. A) Normal bipolar mitotic spindle. B) Monopolar mitotic spindle in a cell treated with 500nM EMD534085 for 4h. C) Non-synchronized cells treated for 4h with 0, 1, 10, 100, 500, 1,000 and 10,000nM EMD534085, EMD596414 or S-trityl-L-cysteine (stlc). All drugs induced mitotic arrest and EMD534085 was the strongest, EC50 for monopoles = ∼70nM, EMD596414 EC50 = ∼200nM, and stlc EC50 = ∼400nM. EMD534085, EMD596414 and stlc were saturating at ∼500nM, ∼500nM, and ∼1,000nM, respectively. All K5Is showed dose-dependence and worked on all cell types tested (not shown). A, B scale bar is 10 μm.
Figure 2
Figure 2. EMD534085 treatment results in dose-dependent mitotic arrest of cells in Colo 205 tumor xenografts
Nude mice bearing COLO 205 tumors were treated with vehicle alone or with EMD534085 via bolus, interperitoneal injection. A, D) Tumor from a vehicle-injected mouse at 8h, stained with haematoxylin (blue nuclei) and anti-phospho-histone H3 (mitotic marker, brown). Mitotic arrest (see methods) was constant over time at ∼7%. B, C) Tumors treated with 20 mg/kg for 8h showed a 25.2% mitotic index and numerous monopolar phospho-histone H3 profiles (arrows). D) Mitotic arrest is dose-dependent and is greatest at ∼8h post-injection of drug. Mitotic arrest was again normal at 48-72h post-injection. Scale bar in A and B is 50 μm, C is 10 μm.
Figure 3
Figure 3. Live-cell imaging identifies phenotypic responses and kinetic relationships between mitotic arrest and death
HeLa, MCF7 and HL60 cells were treated with 500nM EMD534085. A-E) HeLa cells were stably expressing histone H2b-EGFP (insets). Times are for cell 1. B) Cell 1 just arrested as a monopolar spindle (inset). C) At 24h 20min, cell 1 slipped from mitosis. When the cell slipped the chromosomes coalesced and decondensed rapidly (inset). Cell 2 has already slipped to interphase. D, E) Cells 1 and 2 are interphase and cell 1 dies at 32h 10min, 7h 50min post-slippage. F-J) Two MCF7 cells undergo mitotic arrest. Times are for cell 1. G) Cells 1 and 2 are arrested in mitosis; cell 1 has just arrested. H) Cell 1 slipped at 4h 30min, cell 2 left the field. I, J) Cell 1 remains arrested in post-slippage interphase at >56h. K-O) HL60 cells; times are for cell 1. n=nucleoli, which are absent during mitosis. L) Cell 1 has just arrested. M) Cells 1 and 2 are arrested. N, O) Cells 1 and 2 died while arrested, by 5h 45min, and cell 3 is arrested. All movies are available online. P) Monopolar arrested cells proceed through 3 major pathways: death in mitosis, slip from mitosis into aberrant G1 with 4N DNA, or cytokinesis resulting in two G1 cells that are probably aneuploid. Cells that slip may proceed to death, remain arrested or proliferate.
Figure 4
Figure 4. Kaplan-Meier survival analysis reveals multiple modes and timing of death within a single population
A) Overall population survival; t0=time of mitotic arrest. As a population, HL60 died rapidly and completely by 24h. Both HT29 and HeLa died significantly after 24h. For MCF7, N/TERT-1 and U-2 OS most death occurs before 40h. B, C) HeLa and HT29 survival was compared for death within mitosis and post-slip. The HeLa 0.5 survival is 23h for mitotic death and 42.5h for death post-slip. For HT29 the 0.5 survival is 22.5h for mitotic death and 55h for death post-slip. There is a clear temporal separation of the two modes of death. Also, in HeLa, cell loss from death post-slip appears modestly faster than for cell loss during mitosis. M=mitotic death, PS=post-slip death. Note: cell death from mitosis for MCF7 (n=9) and U-2 OS (n=11) was too rare for this comparative analysis. Overall survival curves are based on 212, 355, 331, 348, 185 and 178 HL60, HeLa-H2bGFP, HT29, MCF7, N/TERT-1 and U-2 OS cells, respectively.
Figure 5
Figure 5. Long-term recovery of MCF7 cells is poorest when K5I is removed during mitotic arrest
MCF7 were treated with 500nM EMD534085 for 24 or 48h before drug removal and then followed for 48h using time-lapse. A-E) At 30min, ∼50% of the cells were mitotic. B-E) Mitotic cells either slipped (s) or divided (d). F, G) >70% of mock cells divided and showed little death. For 24h, recovery cells, ∼37% of arrested cells slipped and ∼51% divided and ∼7% of cells divided from interphase. The 24h, recovery cells also showed a ∼4-fold increase in death. For 48h, recovery there were very few mitotic cells that slipped or divided and ∼10% cells divided from interphase. 48h, recovery cells died as much as mock. H, I) Cells at 14 positions from three experiments were scored daily and the fraction with a≥5-fold increase in cell number was plotted. Mock-treated cells recovered completely by day 7. At day 8 the 48h-treated cells showed a recovery of 0.6 (± 0.14) while the 24h-treated cells showed only 0.2 (± 0.04). I) Mean fold-recovery at day 8 was 16.5 for mock (13/14 ≥5-fold recovery), 3.9 for 24h, recovery (2/14 ≥5-fold recovery), and 9.4 for 48h, recovery (9/14 ≥5-fold recovery). Bracketed line=90% confidence interval.
Figure 6
Figure 6. MCF7 cells dividing after K5I removal show chromosome attachment and segregation errors
MCF7 cells treated for 24h with 500nM EMD534085 were washed into recovery, fixed and stained with α-tubulin, DNA and sometimes CREST. Chromosome alignment and mis-segregations were scored at 4h recovery. A, A′, E) Control MCF7 cell in metaphase; ∼20% of control MCF7 or RPE1 cells show unaligned chromosomes (abnormal metaphase). B, B′, E) After 4h recovery, ∼60% of the preanaphase spindles show non-congressed, mono-oriented chromosome pairs (arrow); ∼60% of RPE cells at 4h recovery also show these alignment defects (not shown). C-D′, E) ∼55% of anaphase MCF7 cells at 4h recovery showed lagging (C′, arrow) or incorrectly attached (D′, arrow, inset) chromosomes. D′ shows a chromosome pair (inset). Anaphase cells in mock, 4h recovery MCF7 and RPE1 showed ≤5% with lagging or incorrectly attached chromosomes (abnormal anaphase). (F) ∼20% of interphase MCF7 cells at 4h recovery contained micronuclei with 2 or 1 CREST spots and ∼5% contained micronuclei with no CREST spots; RPE1 interphase cells showed essentially no micronuclei.

Similar articles

Cited by

References

    1. Jordan MA, Wilson L. Microtubules as a target for anticancer drugs. Nat Rev Cancer. 2004;4:253–65. - PubMed
    1. Hamel E. Antimitotic natural products and their interactions with tubulin. Med Res Rev. 1996;16:207–31. - PubMed
    1. Rieder CL, Maiato H. Stuck in division or passing through: what happens when cells cannot satisfy the spindle assembly checkpoint. Dev Cell. 2004;7:637–51. - PubMed
    1. Brito DA, Rieder CL. Mitotic checkpoint slippage in humans occurs via cyclin B destruction in the presence of an active checkpoint. Curr Biol. 2006;16:1194–200. - PMC - PubMed
    1. Jackson JR, Patrick DR, Dar MM, Huang PS. Targeted anti-mitotic therapies: can we improve on tubulin agents? Nat Rev Cancer. 2007;7:107–17. - PubMed

Publication types