Comparative Study
. 2008;3(10):e3577.
doi: 10.1371/journal.pone.0003577. Epub 2008 Oct 30.

Magnitude and complexity of rectal mucosa HIV-1-specific CD8+ T-cell responses during chronic infection reflect clinical status

Affiliations
Comparative Study

Magnitude and complexity of rectal mucosa HIV-1-specific CD8+ T-cell responses during chronic infection reflect clinical status

J William Critchfield et al. PLoS One. 2008.

Abstract

Background: The intestinal mucosa displays robust virus replication and pronounced CD4+ T-cell loss during acute human immunodeficiency virus type 1 (HIV-1) infection. The ability of HIV-specific CD8+ T-cells to modulate disease course has prompted intensive study, yet the significance of virus-specific CD8+ T-cells in mucosal sites remains unclear.

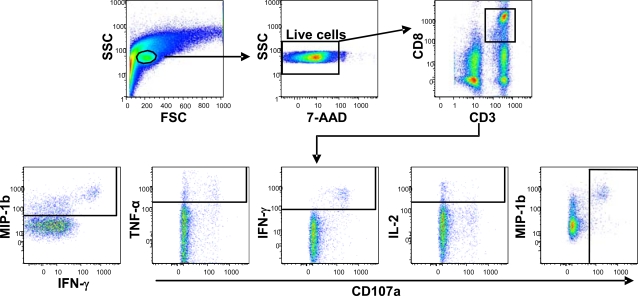
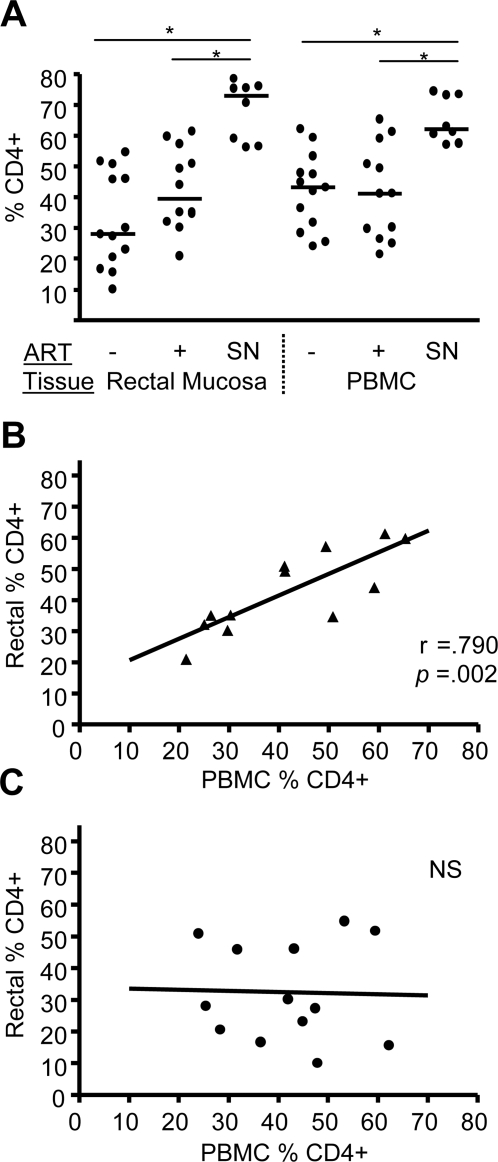
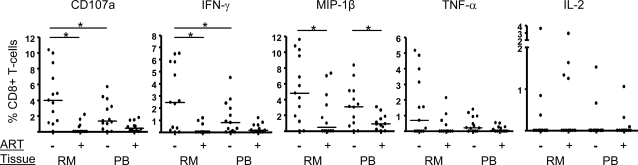
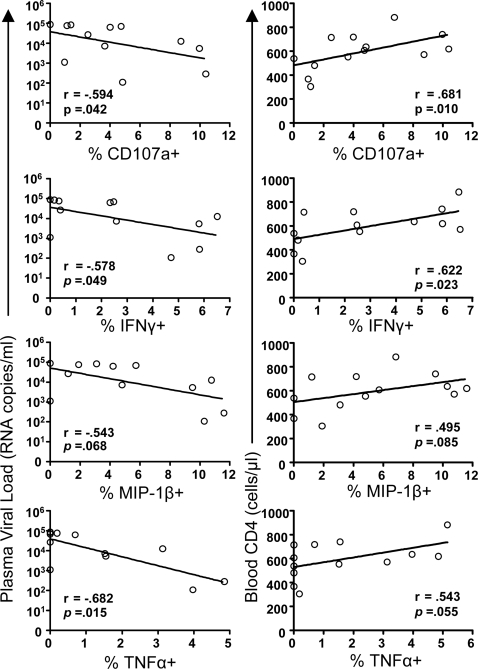
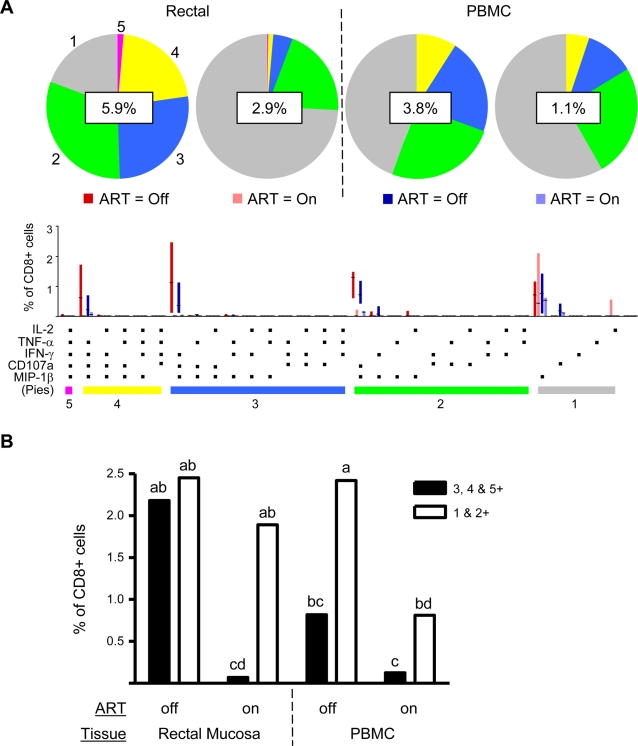
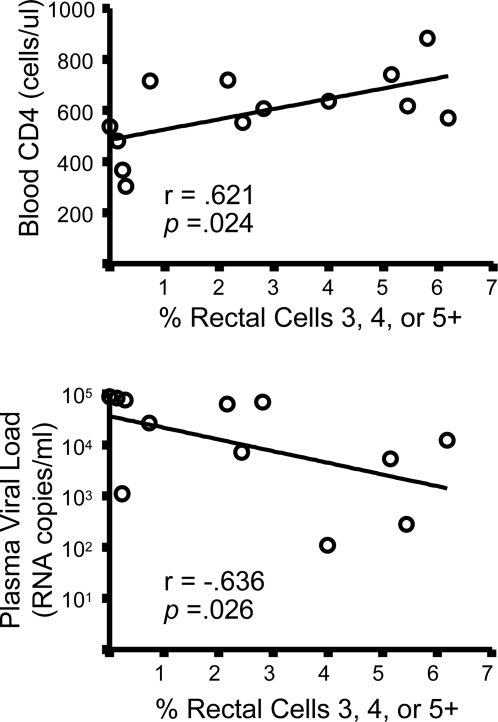
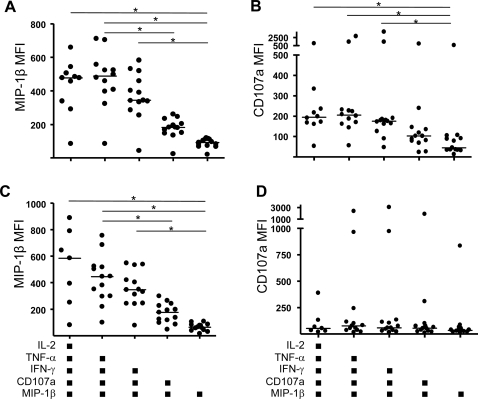
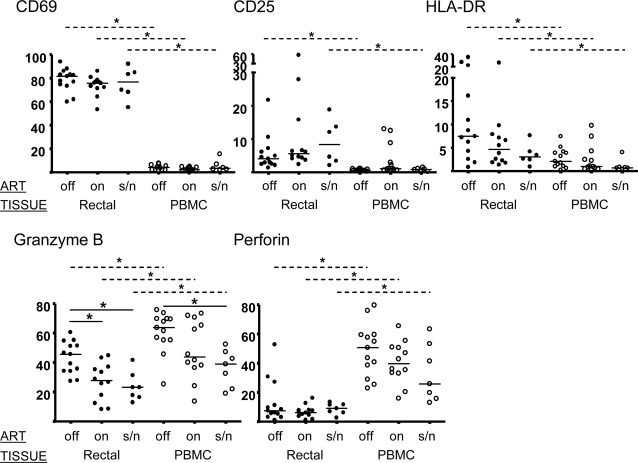
Methods and findings: We evaluated five distinct effector functions of HIVgag-specific CD8+ T-cells in rectal mucosa and blood, individually and in combination, in relationship to clinical status and antiretroviral therapy (ART). In subjects not on ART, the percentage of rectal Gag-specific CD8+ T-cells capable of 3, 4 or 5 simultaneous effector functions was significantly related to blood CD4 count and inversely related to plasma viral load (PVL) (p<0.05). Polyfunctional rectal CD8+ T-cells expressed higher levels of MIP-1beta and CD107a on a per cell basis than mono- or bifunctional cells. The production of TNFalpha, IFN-gamma, and CD107a by Gag-specific rectal CD8+ T-cells each correlated inversely (p<0.05) with PVL, and MIP-1beta expression revealed a similar trend. CD107a and IFN-gamma production were positively related to blood CD4 count (p<0.05), with MIP-1beta showing a similar trend. IL-2 production by rectal CD8+ T-cells was highly variable and generally low, and showed no relationship to viral load or blood CD4 count.

Conclusions: The polyfunctionality of rectal Gag-specific CD8+ T-cells appears to be related to blood CD4 count and inversely related to PVL. The extent to which these associations reflect causality remains to be determined; nevertheless, our data suggest a potentially important role for mucosal T-cells in limiting virus replication during chronic infection.


Conflict of interest statement

Competing Interests: The authors have declared that no competing interests exist.

Figures

Figure 1
Figure 1. Flow cytometry gating method used in the analysis of CD8+ T-cell responses.
Shown is a typical rectal mucosal cell preparation that was stimulated with HIVgag peptides. After initial estimation of a lymphocyte gate based on forward versus side scatter, viable cells (7-AAD negative) were carried forward for selection of CD3+CD8+ cells. The resulting CD3+CD8+ population was further gated based on positivity for each of the 5 functional responses measured: MIP-1β, TNF-α, IFN-γ, IL-2 and CD107a. The frequencies of cells in these populations were corrected using background values (costimulation only) and then compiled and analyzed directly. For more detailed analyses, the 5 populations were instead entered into Boolean gating analysis to generate 31 populations consisting of all possible combinations of functionality (the 32nd population representing cells negative for all 5 functions was ignored). Background correction was applied after Boolean gating (see Methods).
Figure 2
Figure 2. CD4+ T-cell percentages in rectal mucosa and peripheral blood.
(A) CD4 values for rectal mucosa and peripheral blood are indicated as a percentage of CD3+ cells for subjects on and off ART, and seronegative subjects. The horizontal line denotes the median. Statistically significant differences (p<0.05) within each tissue are denoted by a line with asterisk. SN, seronegative. (B & C) Correlation analysis (Spearman) of CD4+ T-cell percentages from each tissue for patients on ART (Part B, filled triangles) and not on ART (Part C, filled circles). Lines represent best fits as estimated by linear regression.
Figure 3
Figure 3. Individual responses to HIVgag peptides mounted by rectal mucosal and peripheral CD8+ T-cells.
Following peptide stimulation, cells were evaluated for five distinct functions (i.e., production of IFN-γ, TNF-α, IL-2, MIP-1β and CD107a) using flow cytometry. Values shown are the percentage of CD8+ T-cells positive for a given function, with medians indicated by a horizontal line. Statistically significant differences between groups (p<0.05) are denoted by a line with an asterisk. RM, rectal mucosa, PB, peripheral blood, ‘−’, not on ART; ‘+’, on ART.
Figure 4
Figure 4. Correlation (Spearman) of rectal CD8+ T-cell responses to plasma viral load or blood CD4 count in patients not on ART.
CD8+ T-cell responses (shown as percentages of cells producing cytokines/chemokines or CD107a, as in Fig. 3), were plotted against viral load and CD4 percentages. Results for Spearman r value and level of significance are shown. Lines represent best fits as estimated by linear regression. Comparable relationships between PBMC functional responses and clinical parameters are not shown, as none were statistically significant.
Figure 5
Figure 5. Detailed HIVgag response profile for CD8+ T-cells in rectal mucosa and blood.
(A) Response profiles were generated using Boolean analysis of 5 functional response gates, resulting in 31 separate categories as described in the text. The percentage value shown in the center of each pie diagram denotes the total magnitude of CD8+ T-cells responding in any way (i.e., a summation across all 31 categories). Individual color-coded pie slices represent the fraction of cells within the total responding population displaying 5, 4, 3, 2, or 1 function(s), beginning at ‘12 o-clock’ and moving clock-wise, as compiled from the bar graph data. The bar graph provides fine detail on frequencies within each of the individual 31 categories; interquartile ranges and medians are shown. (B) Results from linear mixed model analysis of HIVgag-specific responses. ART status, tissue type, and polyfunctionality were treated as fixed effects (see Methods). Polyfunctional cells (open bars) were defined as cells positive for 3, 4, or 5 functions, and non-polyfunctional cells (closed bars) were defined as cells positive for 1 or 2 functions. Letters are statistical notations; bars that do not share a common letter are significantly different (p<0.05).
Figure 6
Figure 6. Correlation (Spearman) of polyfunctional rectal CD8+ T-cell responses and plasma viral load or blood CD4 count.
Polyfunctionality was defined as the summed frequencies of the 5+ and predominant 4+ & 3+ groups (as shown in the bar graph, Fig. 4). This derived value was plotted (X-axis) against blood CD4 count or plasma viral load (Y-axis). Results for r and level of significance are shown. Comparable relationships between PBMC polyfunctional responses and clinical parameters are not shown, as they were not statistically significant.
Figure 7
Figure 7. Median fluorescence intensity (MFI) of MIP-1β and CD107a staining of HIVgag specific CD8+ T-cells in relation to response category.
(A & B) Rectal mucosa. (C & D) Peripheral blood. Statistically significant differences (p<0.05) are denoted by a line with an asterisk.
Figure 8
Figure 8. Phenotypic features of CD8+ T-cells from PBMC and rectal mucosa.
Unstimulated cells were stained for surface markers and intracellular antigens and analyzed by flow cytometry. The percentage of CD8+ T-cells positive for each marker is given on the Y-axis. Median values are indicated by a horizontal line. Statistically significant differences between groups (p<0.05) are denoted by an asterisk with solid line (Kruskal-Wallis) or broken line (Paired T-test). Rectal mucosa (filled circles); PBMC (open circles); ‘off’, not on ART; ‘on’, on ART; s/n, seronegative.

Similar articles

Cited by

References

    1. Koup RA, Safrit JT, Cao Y, Andrews CA, McLeod G, et al. Temporal association of cellular immune responses with the initial control of viremia in primary human immunodeficiency virus type 1 syndrome. J Virol. 1994;68:4650–4655. - PMC - PubMed
    1. Jin X, Bauer DE, Tuttleton SE, Lewin S, Gettie A, et al. Dramatic rise in plasma viremia after CD8(+) T-cell depletion in simian immunodeficiency virus-infected macaques. J Exp Med. 1999;189:991–998. - PMC - PubMed
    1. Borrow P, Lewicki H, Wei X, Horwitz MS, Peffer N, et al. Antiviral pressure exerted by HIV-1-specific cytotoxic T lymphocytes (CTLs) during primary infection demonstrated by rapid selection of CTL escape virus. Nat Med. 1997;3:205–211. - PubMed
    1. Wodarz D, Hall SE, Usuku K, Osame M, Ogg GS, et al. Cytotoxic T-cell abundance and virus load in human immunodeficiency virus type 1 and human T-cell leukaemia virus type 1. Proc Biol Sci. 2001;268:1215–1221. - PMC - PubMed
    1. Ogg GS, Jin X, Bonhoeffer S, Dunbar PR, Nowak MA, et al. Quantitation of HIV-1-specific cytotoxic T lymphocytes and plasma load of viral RNA. Science. 1998;279:2103–2106. - PubMed

Publication types

MeSH terms

Substances