. 2007 Nov 2:1:4.
doi: 10.3389/neuro.11.004.2007. eCollection 2007.

Three-dimensional atlas system for mouse and rat brain imaging data

Affiliations

Three-dimensional atlas system for mouse and rat brain imaging data

Trine Hjornevik et al. Front Neuroinform. .

Abstract

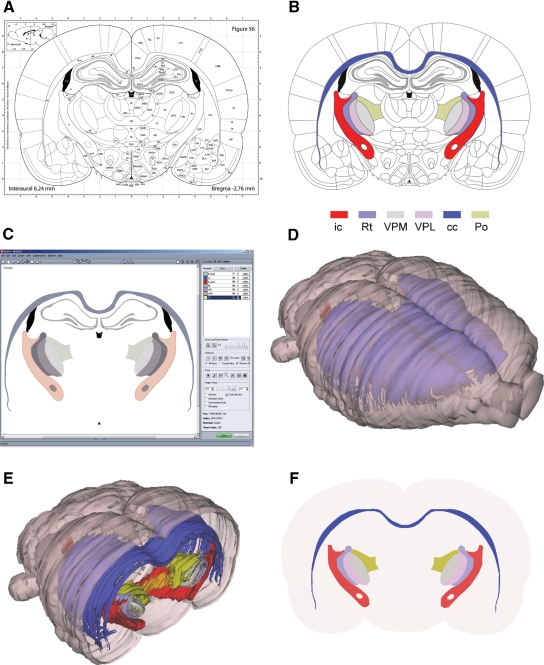
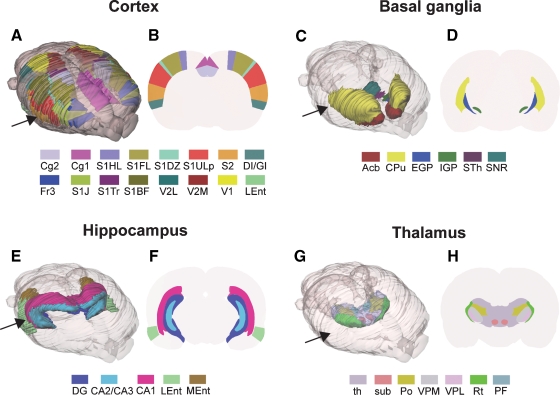
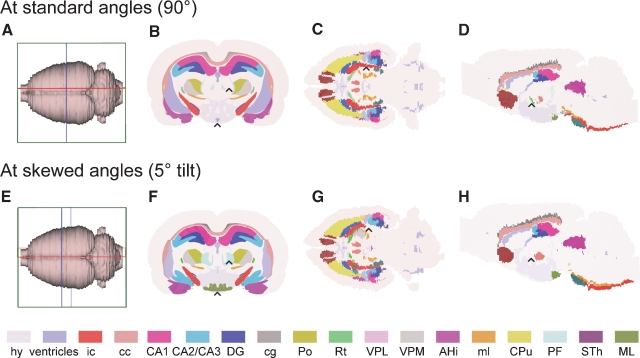
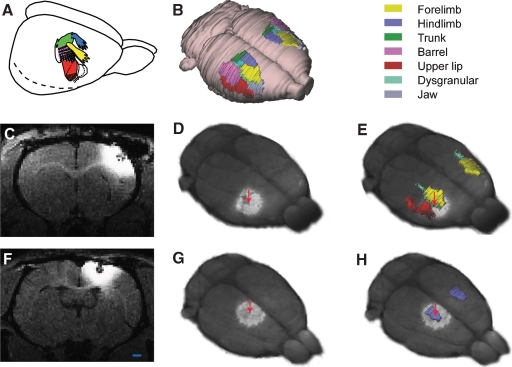
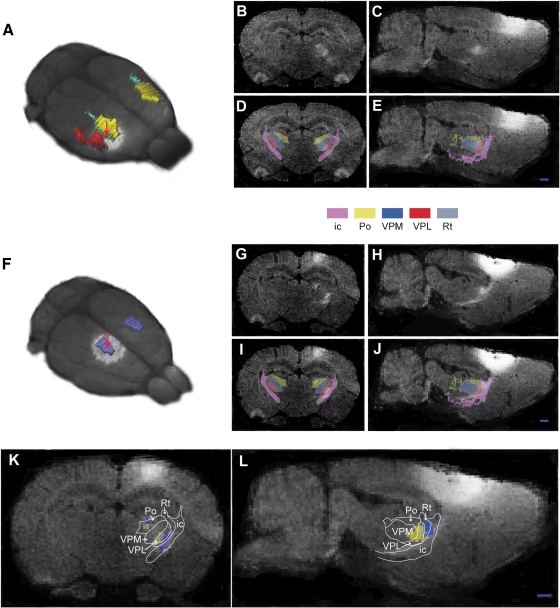
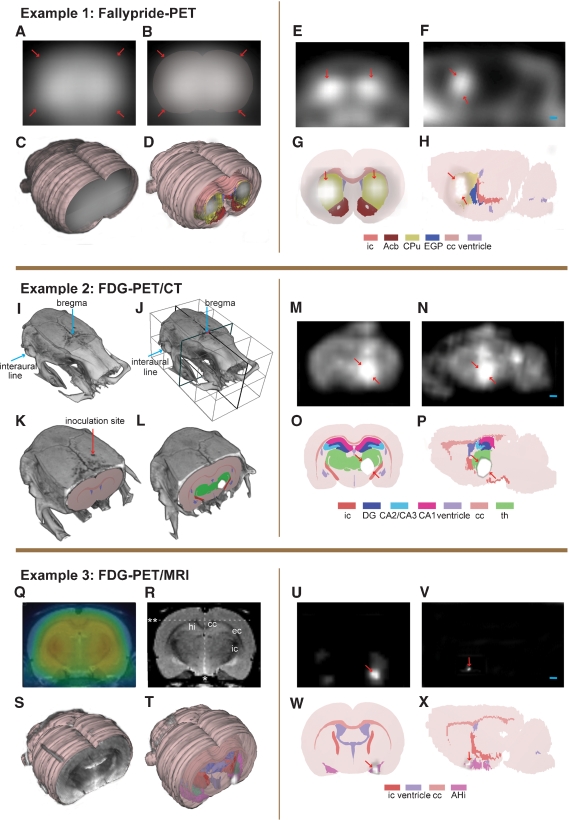
Tomographic neuroimaging techniques allow visualization of functionally and structurally specific signals in the mouse and rat brain. The interpretation of the image data relies on accurate determination of anatomical location, which is frequently obstructed by the lack of structural information in the data sets. Positron emission tomography (PET) generally yields images with low spatial resolution and little structural contrast, and many experimental magnetic resonance imaging (MRI) paradigms give specific signal enhancements but often limited anatomical information. Side-by-side comparison of image data with conventional atlas diagram is hampered by the 2-D format of the atlases, and by the lack of an analytical environment for accumulation of data and integrative analyses. We here present a method for reconstructing 3-D atlases from digital 2-D atlas diagrams, and exemplify 3-D atlas-based analysis of PET and MRI data. The reconstruction procedure is based on two seminal mouse and brain atlases, but is applicable to any stereotaxic atlas. Currently, 30 mouse brain structures and 60 rat brain structures have been reconstructed. To exploit the 3-D atlas models, we have developed a multi-platform atlas tool (available via The Rodent Workbench, http://rbwb.org) which allows combined visualization of experimental image data within the 3-D atlas space together with 3-D viewing and user-defined slicing of selected atlas structures. The tool presented facilitates assignment of location and comparative analysis of signal location in tomographic images with low structural contrast.

Keywords: 3-D reconstruction; atlas; brain; imaging; magnetic resonance imaging; positron emission tomography; stereotaxic; visualization.


Figures

Figure 1
Figure 1
The stepwise 3-D atlas reconstruction procedure. (A) A coronal rat brain atlas diagram (reproduced from Paxinos and Watson, with permission) with the stereotaxic grid, section number, structure labeling and the distance from bregma indicated. (B) The same diagram imported to Illustrator, where regions of interest (ROIs)are selected and assigned a color code. (C) Image of the Amira GUI showing segmented ROIs. (D) Selected 3-D reconstructed structures visualized in the m3d tool. (E) The same reconstruction as shown in (C) coronally sub-divided using the m3d slicing module. (F) Customized atlas diagram, corresponding to (A), exported from m3d. A separate module in m3d is used to render the sub-divided surfaces as solid objects. ic, internal capsule; Rt, reticular thalamic nucleus; VPM, ventral posterolateral thalamic nucleus; VPL, ventral posteromedial thalamic nucleus; cc, corpus callosum; Po, posterior thalamic nucleus.
Figure 2
Figure 2
Examples of rat brain regions included in the 3-D rat brain atlas. (A–H) Atlas representations of four major brain regions visualized as solid, color coded 3-D surfaces within the transparent outer surface of the brain, and as corresponding 2-D coronal slices, obtained from anteroposterior levels indicated by arrows. (A, B) 16 selected cerebrocortical brain regions. (C, D) Major regions of the basal ganglia. (E, F) Hippocampus and entorhinal cortex. (G, H) Selected sub-regions of the thalamus. In (G) thalamus (th)is made transparent in order to visualize the underlying sub-regions. Cg2, cingulate cortex area 2; Cg1, cingulate cortex area 1; S1, primary somatosensory cortex; S1HL, hindlimb region; S1FL, forelimb region; S1DZ, dysgranular zone; S1ULp, upper lip region; S2, secondary somatosensory cortex; DI/GI, insular cortex; Fr3, frontal cortex, area 3; S1J, jaw region; S1Tr, trunk region; S1BF, barrel field; V2L, secondary visual cortex, lateral area; V2M, secondary visual cortex, medial area; V1, primary visual cortex; Lent, lateral entorhinal cortex; Acb, accumbens nucleus; CPu, caudate putamen; EGP, external globus pallidus; IGP, internal globus pallidus; STh, subthalamic nucleus; SNR, substantia nigra; DG, dentate gyrus; CA2/CA3, field CA2 and CA3 of the hippocampus; CA1, field CA1 of the hippocampus; LEnt, lateral entorhinal cortex; MEnt, medial entorhinal cortex; th, thalamus, whole region; sub, submedius thalamic nucleus; Po, posterior thalamic nucleus; VPM, ventral posterolateral thalamic nucleus; VPL, ventral posteromedial thalamic nucleus; Rt, reticular thalamic nucleus; PF, parafasicular thalamic nucleus.
Figure 3
Figure 3
Customized atlas diagrams. Series of customized, color coded coronal (B, F), horizontal (C, G), and sagittal (D, H) atlas diagrams, generated using the slicing and filling module in the atlas tool. Blue, red, and green bounding boxes in (A, E) indicate the levels from which the respective slices were obtained. (A–D) Standard orientation of atlas slices, oriented perpendicularly to axes of the stereotaxic coordinate system. (E–H) Example of atlas slices cut at non-standard angles, tilted 5 degrees from the planes used in (B–D). Black arrow heads indicate examples of structural differences between the corresponding diagram pairs, emphasizing the importance of having atlas diagrams with similar orientation as experimental slices. hy, hypothalamus, whole region; ic, internal capsule; cc, corpus callosum; CA1, field CA1 of the hippocampus; CA2/CA3, field CA2 and CA3 of the hippocampus; DG, dentate gyrus; cg, cingulum; Po, posterior thalamic nucleus; Rt, reticular thalamic nucleus; VPL, ventral posteromedial thalamic nucleus; VPM, ventral posterolateral thalamic nucleus; AHi, amygdalohippocampal area; ml, medial lemniscus; CPu, caudate putamen; PF, parafasicular thalamic nucleus; STh, subthalamic nucleus; ML, medial mammillary nucleus.
Figure 4
Figure 4
MRI and 3-D atlas based localization of MnCl2 injection sites in the cerebral cortex. (A) Color coded drawing of major body representations in the primary somatosensory cortex (SI), modified from Welker (1971), with permission. (B) 3-D reconstructed atlas representation of the brain surface with SI regions indicated in corresponding colors. (C–E) and (F–H) show two different examples, in which MnCl2 was stereotaxically aimed at the forelimb or hindlimb representations of SI, respectively. (C, F) Raw T1-weighted MRI images acquired 9 hours after focal application of MnCl2. At the point of injection a central zone of low signal intensity is visible, surrounded by a halo of bright signal enhancement. (D, GD, G) 3-D reconstructed MRI volume registered to atlas space, showing Mn2+ signal enhancement surrounding the injection sites (arrows). (E, H) The same images combined with atlas reconstructions of relevant SI body representations. Comparison of injection site locations with the atlas surface reconstructions revealed that one injection is centered on the dysgranular zone lateral to the SI forelimb representation, while the other injection is centered on the SI hindlimb representation. Bar, 1 mm.
Figure 5
Figure 5
Corticothalamic topographical organization revealed by MnCl2/MRI tracing and 3-D atlasing. Two cases are shown, case 1 (A–E), in which MnCl2 was injected in the dysgranular zone adjacent to the SI forelimb representation (A), and case 2 (F–J), in which MnCl2 was injected in the hindlimb representation of SI. (B, C and G, H) Raw coronal and sagittal T1-weighted MRI images obtained 9 hours after injection. (D, E and I, J) Corresponding images with overlay of selected reconstructed atlas structures. (K, L) Superimposed, pseudocolored images (case 1, yellow; case 2, blue)with an overlay of atlas derived boundary lines, demonstrating a somatotopical organization of the different signals within the Po and VPM. ic, internal capsule; Po, posterior thalamic nucleus; VPM, ventral posterolateral thalamic nucleus; VPL, ventral posteromedial thalamic nucleus; Rt, reticular thalamic nucleus. Bar, 1 mm.
Figure 6
Figure 6
Alignment and localization of PET data. Example 1: (A–C) perfusion image of [18F]-fallypride image was used for alignment to 3-D atlas space. Arrows indicating surface boundaries. (D) Receptor binding image co-registered with the 3-D atlas model. (E, F) [18F]-fallypride-PET coronal and sagittal images showing high-uptake regions. (G, H) Coronal and sagittal atlas sections localizing the high-uptake PET signals to the basal ganglia. Example 2: (I, J) Bregma and the interaural line in the CT volume. (K) CT volume aligned with the 3-D atlas model. (L) FDG-PET signal aligned with the 3-D atlas on the basis of the same transformation matrix as for the CT volume. (M, N) Coronal and sagittal PET images showing high-uptake of FDG in the brain tumor. (O, P) Coronal and sagittal atlas diagrams locating the brain tumor in the right thalamic region. Example 3: (Q) co-registered FDG-PET image (colors)and MRI template. (R, S) MRI template aligned to the 3-D atlas space on the basis of defined landmarks. *, midline; **, upper boundary of cc. (T) SPM result volume aligned with atlas space using the transformation matrix obtained from the MRI alignment. (U, V) Coronal and sagittal SPM result images showing statistical significant voxels (p < 0.05). (W, X) Coronal and sagittal atlas diagrams locating the significant signal to the rostral part of the amygdala. ic, internal capsule; Acb, accumbens nucleus; CPu, caudate putamen; EGP, external globus pallidus; cc, corpus callosum; DG, dentate gyrus; CA2/CA3, field CA2 and CA3 of the hippocampus; CA1, field CA1 of the hippocampus; th, thalamus, whole region; hi, hippocampal region; ec, external capsule; AHi, amygdalohippocampal area. Arrow, indicate boundaries of regions with increased PET signal. Bar, 1 mm.

Similar articles

Cited by

References

    1. Ali A. A., Dale A. M., Badea A., Johnson G. A. (2005). Automated segmentation of neuroanatomical structures in multispectral MR microscopy of the mouse brain. Neuroimage 27, 425–435 - PubMed
    1. Badea A., li-Sharief A. A., Johnson G. A. (2007). Morphometric analysis of the C57BL/6J mouse brain. Neuroimage 37, 683–693 - PMC - PubMed
    1. Benveniste H., Kim K., Zhang L., Johnson G. A. (2000). Magnetic resonance microscopy of the C57BL mouse brain. Neuroimage 11, 601–611 - PubMed
    1. Boline J. K., MacKenzie-Graham A. A., Shattuck D. W., Yuan H., Anderson S. P., Sforza D. M., Wang J., Williams R. W., Wong W., Martone M. E., Zaslavsky I., Toga A. W.A Digital Atlas and Neuroinformatics Framework for Query and Display of Disparate Data. (2006). Society for Neuroscience 2006. Abstract and itinerary viewer. Program No. 100. 12
    1. Brevik A., Leergaard T. B., Svanevik. M., Bjaalie J. G. (2001). Three dimensional computerised atlas of the rat brain stem precerebellar system: approaches for mapping, visualization, and comparison of spatial distribution data. Anat. Embryol. (Berl.) 204, 319–332 - PubMed

LinkOut - more resources