. 2008 Oct;4(10):e1000243.
doi: 10.1371/journal.pgen.1000243. Epub 2008 Oct 31.

Adaptive copy number evolution in malaria parasites

Affiliations

Adaptive copy number evolution in malaria parasites

Shalini Nair et al. PLoS Genet. 2008 Oct.

Abstract

Copy number polymorphism (CNP) is ubiquitous in eukaryotic genomes, but the degree to which this reflects the action of positive selection is poorly understood. The first gene in the Plasmodium folate biosynthesis pathway, GTP-cyclohydrolase I (gch1), shows extensive CNP. We provide compelling evidence that gch1 CNP is an adaptive consequence of selection by antifolate drugs, which target enzymes downstream in this pathway. (1) We compared gch1 CNP in parasites from Thailand (strong historical antifolate selection) with those from neighboring Laos (weak antifolate selection). Two percent of chromosomes had amplified copy number in Laos, while 72% carried multiple (2-11) copies in Thailand, and differentiation exceeded that observed at 73 synonymous SNPs. (2) We found five amplicon types containing one to greater than six genes and spanning 1 to >11 kb, consistent with parallel evolution and strong selection for this gene amplification. gch1 was the only gene occurring in all amplicons suggesting that this locus is the target of selection. (3) We observed reduced microsatellite variation and increased linkage disequilibrium (LD) in a 900-kb region flanking gch1 in parasites from Thailand, consistent with rapid recent spread of chromosomes carrying multiple copies of gch1. (4) We found that parasites bearing dhfr-164L, which causes high-level resistance to antifolate drugs, carry significantly (p = 0.00003) higher copy numbers of gch1 than parasites bearing 164I, indicating functional association between genes located on different chromosomes but linked in the same biochemical pathway. These results demonstrate that CNP at gch1 is adaptive and the associations with dhfr-164L strongly suggest a compensatory function. More generally, these data demonstrate how selection affects multiple enzymes in a single biochemical pathway, and suggest that investigation of structural variation may provide a fast-track to locating genes underlying adaptation.


Conflict of interest statement

The authors have declared that no competing interests exist.

Figures
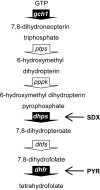
Figure 1
Figure 1. The folate biosynthesis pathway of P. falciparum.
The steps catalyzed by gch1, dhfr and dhps are highlighted. The positions at which antifolate drugs (Pyrimethamine (PYR) and Sulfadoxine (SDX)) target the pathway are marked. Abbreviations: pyruvoyltetrahydropterin synthase (ptps), hydroxymethyldihydropterin pyrophosphokinase (pppk), dihydrofolate synthase (dhfs). Modified from .
Figure 2
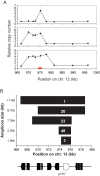
Figure 2. Structure and gene content of gch1 amplicons.
The span of each amplicon was established by real-time PCR and breakpoint specific PCR assays. (a) Real-time PCR estimates of relative copy number plotted for 9 genes including gch1 on chr. 12. The error bars show 95% confidence intervals around the copy number estimate. The three plots show the profiles observed for the 2.3 kb (top), 7.3 kb (middle) and 8.7 kb (bottom) amplicons. The location of gch1 is marked by a red bar (b) Plot showing the span of the 5 amplicons types. The abundance of each of the amplicon types in the Thai sample is shown in white on the bars. The gene content in this region of the chr. 12 are shown beneath the graph: all breakpoints were between genes. The 5′ boundary for the >11 kb amplicon fell outside the range of our real-time PCR assays and was not defined: the bar shows the minimum size estimate for this amplicon.
Figure 3
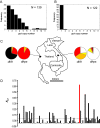
Figure 3. Geographical differentiation of the gch1 CNP.
The frequency of chromosomes carrying different gch1 copy number is plotted in Thailand (a) and Laos (b). (c) Map showing sampling locations in Thailand and Laos. The pie charts show the representation of alleles present at known genes involved in antifolate resistance, and provides a molecular indicator of the strength of antifolate selection on these two populations. White-wild type, yellow-1 mutation, orange-2 mutations, red-3 mutations, black-4 mutations. See table S5 for details of the alleles present. (d) The distribution of FST for gch1 CNP and for 73 polymorphic sSNPs. The markers are plotted by position across the genome. The mean FST for sSNPs is marked by the dotted line.
Figure 4
Figure 4. Genetic Diversity on chr. 12 in Thailand and Laos.
Expected Heterozygosity plotted across chr. 12 in Thailand and Laos. The red arrow marks the position of gch1. Markers are ordered on the x-axis which is not shown to scale.
Figure 5
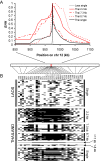
Figure 5. Haplotype structure and LD decay around gch1.
(a) Plots of EHH for markers flanking gch1 from Thailand and Laos. In Thailand, EHH is plotted for the three predominant amplicon types (2.2, 7.3 and 8.7 kb). EHH for chromosomes with single copies of gch1 from both countries is shown for comparison. (b) Visual representation of LD. Microsatellite data was reduced to binary form by coloring the predominant allele in black and all other alleles in white. The 33 loci typed are arranged in order across the chromosome, while samples are arranged in rows. The country of origin of each sample is shown on the left, while the amplicon type (Figure 2) is shown on the right.
Figure 6
Figure 6. The dhfr-164L resistance mutation is associated with gch1 CNP in Thailand.
(a) Thai parasites were ranked by gch1 CNP. Error bars show 95% CI around copy number estimates. Open black circles or closed red circles indicate isolates carrying 164I or 164L at dhfr. (b) Association between 55 polymorphic sSNPs and gch1 CNP. Raw p-values from t-tests of log transformed copy number estimates are plotted; very similar p-values were obtained from non-parametic Mann-Whitney U-tests using untransformed copy number estimates. Dotted horizontal lines show thresholds for significance following Bonferroni correction for multiple testing. The bars show the strength of associations between gch1 CNP and dhfr-I164L (solid red), between polymorphic SNPs in dhfr (N51I) and dhps (S436A, K540E, A581G) (open red bars), and between 55 sSNPs (black). There was only one SNP (MAL04-469608) other than dhfr-164L that crossed the Bonferroni-corrected threshold of p<0.05.
Figure 7
Figure 7. Correlation between gch1 CNP and expression for 6 parasite isolates.
We measured gene expression and copy number at 4 different time points in the asexual cycle. Error bars indicate 95% CI for estimates of both CNP and expression. Details of the real-time PCR assay are shown in Table S2. Linear regression summary statistics (slope, r2, F, p-value) for the four time points were as follows: 0–6 hrs: 0.63, 0.71, 10.36, 0.032, 8–14 hrs: 0.649, 0.87, 25.89, 0.007, 24–30 hrs: 0.419, 0.621, 6.54, 0.063, 32–40 hrs: 0.46, 0.85, 22.01, 0.009).

Similar articles

Cited by

References

    1. Cooper GM, Nickerson DA, Eichler EE. Mutational and selective effects on copy-number variants in the human genome. Nat Genet. 2007;39:S22–S29. - PubMed
    1. Perry GH, Tchinda J, McGrath SD, Zhang J, Picker SR, et al. Hotspots for copy number variation in chimpanzees and humans. Proc Natl Acad Sci U S A. 2006;103:8006–8011. - PMC - PubMed
    1. Freeman JL, Perry GH, Feuk L, Redon R, McCarroll SA, et al. Copy number variation: new insights in genome diversity. Genome Res. 2006;16:949–961. - PubMed
    1. Dopman EB, Hartl DL. A portrait of copy-number polymorphism in Drosophila melanogaster. Proc Natl Acad Sci U S A. 2007;104:19920–19925. - PMC - PubMed
    1. Cutler G, Marshall LA, Chin N, Baribault H, Kassner PD. Significant gene content variation characterizes the genomes of inbred mouse strains. Genome Res. 2007;17:1743–1754. - PMC - PubMed

Publication types

MeSH terms