. 2008;3(10):e3598.
doi: 10.1371/journal.pone.0003598. Epub 2008 Oct 31.

Independence of echo-threshold and echo-delay in the barn owl

Affiliations

Independence of echo-threshold and echo-delay in the barn owl

Brian S Nelson et al. PLoS One. 2008.

Abstract

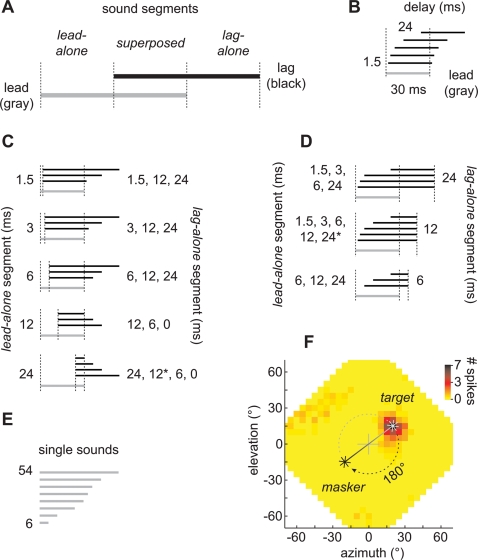
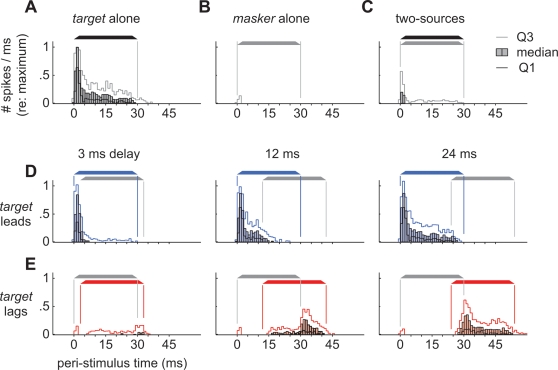
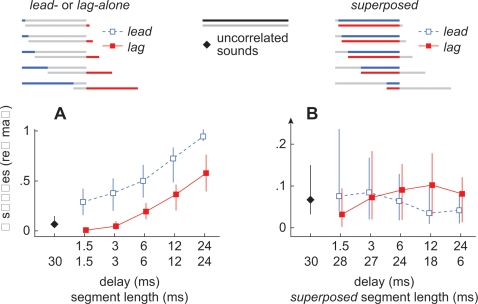
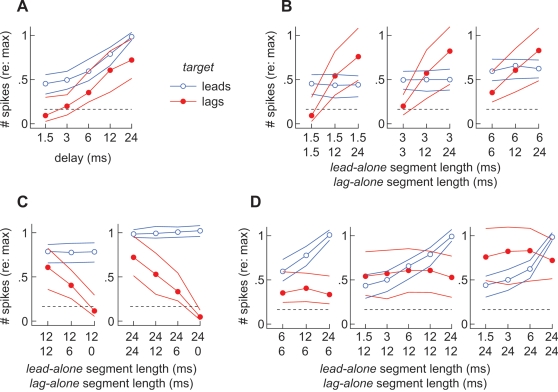
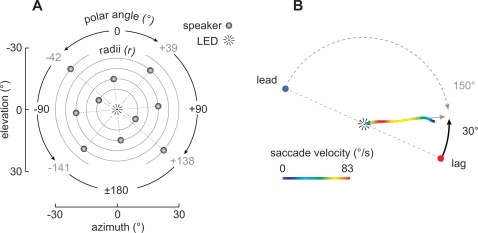
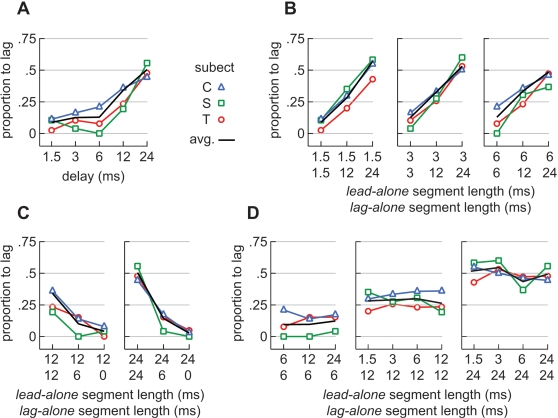
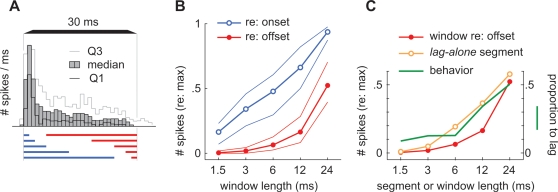
Despite their prevalence in nature, echoes are not perceived as events separate from the sounds arriving directly from an active source, until the echo's delay is long. We measured the head-saccades of barn owls and the responses of neurons in their auditory space-maps while presenting a long duration noise-burst and a simulated echo. Under this paradigm, there were two possible stimulus segments that could potentially signal the location of the echo. One was at the onset of the echo; the other, after the offset of the direct (leading) sound, when only the echo was present. By lengthening the echo's duration, independently of its delay, spikes and saccades were evoked by the source of the echo even at delays that normally evoked saccades to only the direct source. An echo's location thus appears to be signaled by the neural response evoked after the offset of the direct sound.


Conflict of interest statement

Competing Interests: The authors have declared that no competing interests exist.

Figures

Figure 1
Figure 1. Stimulus configurations.
(A) Overlapping lead (direct) and lag (simulated reflection) sounds. The temporal overlap defines periods of time during which both sounds were superposed, flanked by periods when the lead or lag sources were present alone. (B) Stimuli presented in the standard precedence effect, paradigm. The lead (gray) and lag (black) sounds were of equal length (30 ms) and onset-delay was 1.5, 3, 6, 12, or 24 ms. (C) Stimuli in which lag-alone segments were experimentally lengthened or shortened while maintaining a constant duration lead-alone segment (constant lead/lag delay). Lead and lag sounds were of unequal lengths. (D) Stimuli in which lead-alone segments were experimentally lengthened or shortened while maintaining a constant duration lag-alone segment (converse of C). When the lead-alone segment was 24 ms, the length of the lag-alone segment was shortened to 12 ms only in our physiological experiments (indicated by asterisks). (E) Single-source sounds among which paired-source stimuli were randomly interspersed in our behavioral experiments. Their durations were roved from 6–54 ms to invalidate duration as a possible cue. (F) Placement of sound sources in our physiological experiments. The plot represents the frontal hemisphere of the owl's auditory space . Positive azimuths and elevations correspond to loci to the right and above an owl, respectively. A cell's SRF is shown in pseudo-color along with a scale bar indicating the average spike number over 4 repetitions. The source in the optimal location within the cell's SRF is referred to as the target. A second source placed at a location diametrically opposed across the owl's center of gaze from the target is referred to as the masker. In the experiments, the target or masker could lead, allowing us to examine a cell's response to simulated direct sounds and echoes.
Figure 2
Figure 2. Peri-stimulus time histograms (PSTHs) showing neural responses evoked by a subset of stimuli.
Each bar shows the median neural response (>50 repetitions/cell; 1-ms bins). Thin lines show the first and third quartiles (Q1, Q3). Each cell's response was normalized to the maximum number of spikes evoked, within a single bin (usually the first or second bin after 0-ms), by 30 ms noise-bursts presented from the center of each cell's SRF . (A) Responses evoked by a single 30 ms target. (B) Responses evoked by a single 30 ms masker. (C) Responses evoked by two, simultaneous, uncorrelated, noise-bursts presented from both the masker and target loci. (D) Responses evoked when the target led by 3, 12 or 24 ms. (E) Responses evoked when the target lagged.
Figure 3
Figure 3. Summary of neural responses evoked during the lead-alone, lag-alone, and superposed segments.
(A) Responses evoked during the lead-alone (open, blue, squares) and lag-alone (closed, red, squares) segments. Each data point represents the median number of spikes, normalized to the average response evoked, in each cell, by 30 ms sounds (>50 repetitions) presented from the center of its SRF . Vertical lines indicate the first and third quartiles of each response. The upper row of numbers along the abscissa represents the onset-delay and the bottom row represents the length of each segment. (B) Responses evoked during the superposed segments when the target led (open, blue, squares) or lagged (closed, red, squares). Responses evoked by two, simultaneous, uncorrelated, noise-bursts from the target and masker loci are indicated by black diamonds (A,B). Note that the ordinate axis in panel B is expanded relative to that of panel A.
Figure 4
Figure 4. Summary of overall neural responses to lead and lag targets.
(A) Responses evoked in the standard paradigm in which lead-alone and lag-alone segments were of equal length. (B) Responses evoked when lag-alone segments were experimentally lengthened. At each point along the abscissa, the number on top indicates the length of the lead-alone segment. The number underneath indicates the length of the lag-alone segment. (C) Responses evoked when lag-alone segments were experimentally shortened. (D) Responses shown here have been regrouped so that the length of the lag-alone segment is constant within each panel. All data points represent the median number of spikes evoked when the target led (blue lines) or lagged (red lines). Thin lines indicate the first and third quartiles of each response. Each value is normalized to the average response evoked, in each cell, by 30 ms sounds (>50 repetitions) presented from the center of its SRF . The dashed horizontal line represents the median response evoked by two, simultaneous, uncorrelated, noise-bursts from target and masker loci.
Figure 5
Figure 5. Behavioral paradigm.
(A) Placement of 10 loudspeakers and a central fixation LED, in polar coordinates. In trials with a lead/lag pair, one of the pair of speakers was assigned a radius of 10°, 15°, 20°, 25°, or 30° and a random polar angle. The second member of the pair had an identical radius, but was 180° opposite the first speaker. Corresponding Cartesian coordinates (azimuth and elevation) are also shown. The stimulus paradigms used in the behavioral trials were identical to those shown in Fig. 1 for physiology. (B) Example of a head saccade. The saccade shown here was made with an unusually large error (30°) relative to that of the closest source, in this case, the lagging source. Despite this error, the angle of the saccade was far greater when compared with that of the leading source (150°), thereby allowing us to determine whether the saccade was lead- or lag-directed. The color scale indicates saccade velocity.
Figure 6
Figure 6. Proportions of trials on which saccades were lag-directed for three birds.
(A) Proportion of lag-directed saccades in the standard paradigm plotted against the lead/lag delay. The black, dashed, line in this and other plots shows the average of all three subjects. (B) Proportion of lag-directed saccades observed when lag-alone segments were experimentally lengthened. At each point along the abscissa, the number on top indicates the length of the lead-alone segment (onset-delay). The number underneath indicates the length of the lag-alone segment. (C) Proportion of lag-directed saccades observed when lag-alone segments were experimentally shortened. (D) Proportions of lag-directed saccades shown here have been regrouped so that the length of the lag-alone segment is constant within each panel.
Figure 7
Figure 7. Potential explanation for localization dominance in the responses of neurons to single sounds.
(A) PSTH showing the median neural responses that were evoked, in our sample of cells, by single-source targets (shown also in Fig. 2A). (B) Neural responses measured in time-windows of length and position that were the same as the lead-alone (onset; blue lines) or lag-alone segments (offset; red lines) under the standard paradigm. (C) Median responses evoked by lag-alone segments (orange line; shown also in Fig. 3A) and by single sounds during equivalent time-windows (red line; redrawn from panel A). The green line shows the proportion of lag-directed saccades for all subjects under the standard paradigm (shown also in Fig. 6A).

References

    1. Blauert J. Spatial Hearing: The Psychophysics of Human Sound Localization, Revised Edition. Cambridge, MA: The MIT Press; 1997.
    1. Haas H. Uber den einfluss eines einfachechos auf die horsamkeit von sprache [On the influence of a single echo on the intelligibility of speech]. Acustica. 1951;1:49–58.
    1. Litovsky RY, Colburn HS, Yost WA, Guzman SJ. The precedence effect. J Acoust Soc Am. 1999;106:1633–1654. - PubMed
    1. Wallach H, Newman EB, Rosenzweig MR. The precedence effect in sound localization. Am J Psychol. 1949;57:315–336. - PubMed
    1. Litovsky RY, Shinn-Cunningham B. Investigation of the relationship among three common measures of precedence: fusion, localization dominance, and discrimination suppression. J Acoust Soc Am. 2001;109:346–358. - PubMed

Publication types