. 2008 Oct;35(10):4545-55.
doi: 10.1118/1.2975483.

Temperature and hydration effects on absorbance spectra and radiation sensitivity of a radiochromic medium

Affiliations

Temperature and hydration effects on absorbance spectra and radiation sensitivity of a radiochromic medium

Alexandra Rink et al. Med Phys. 2008 Oct.

Abstract

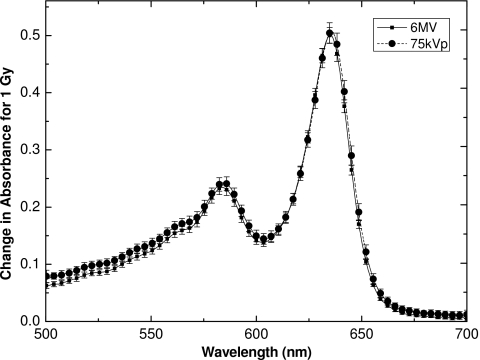
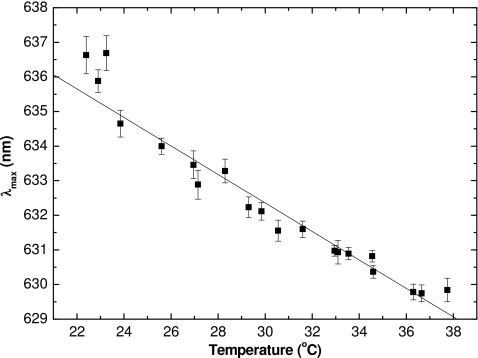
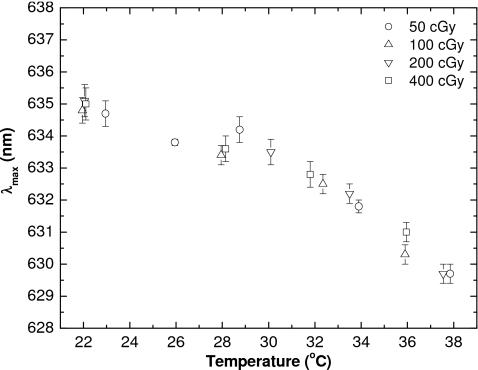
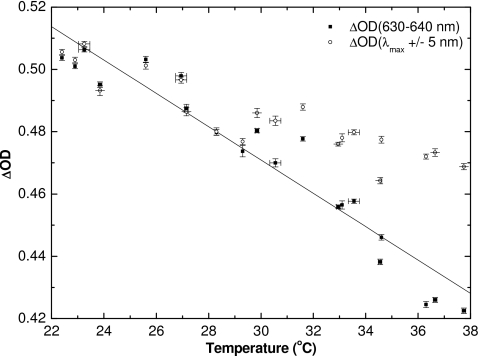
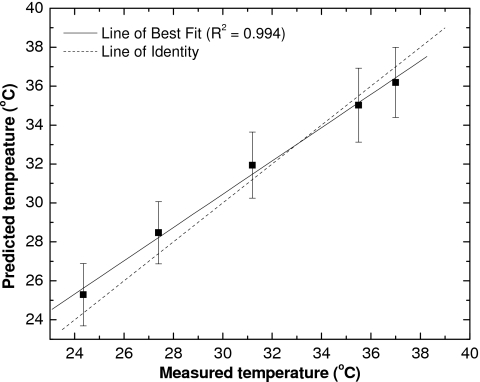
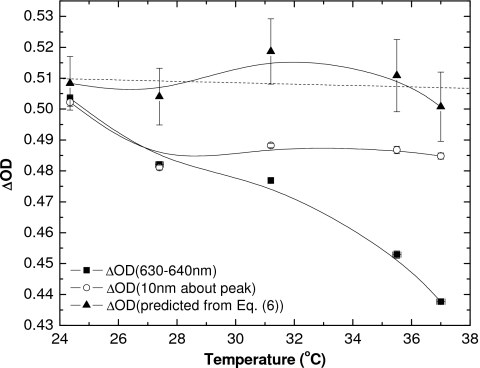
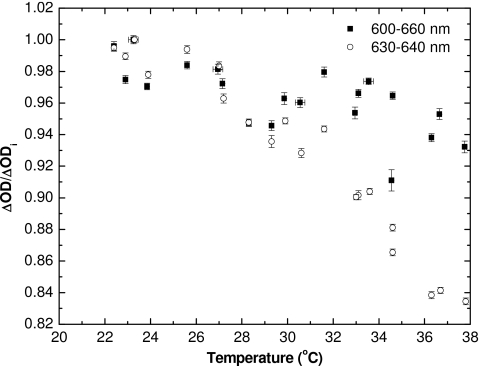
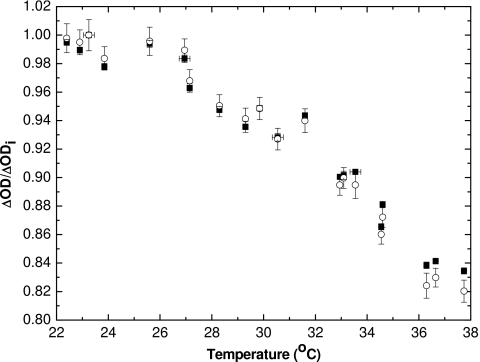
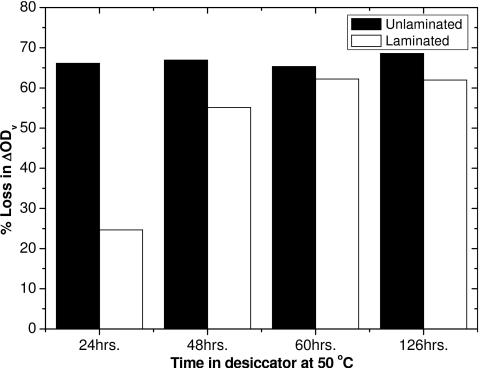
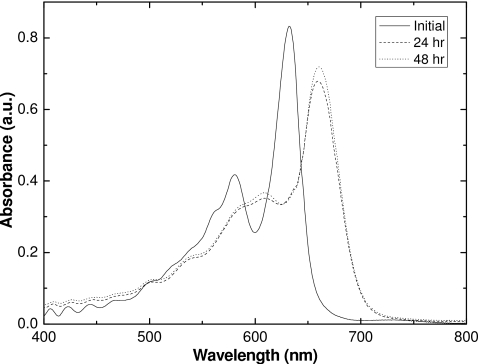
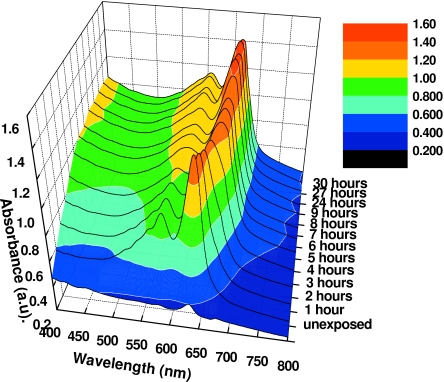
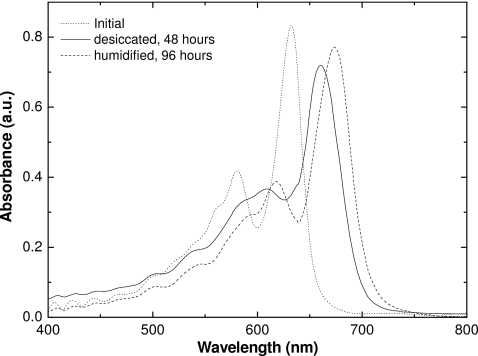
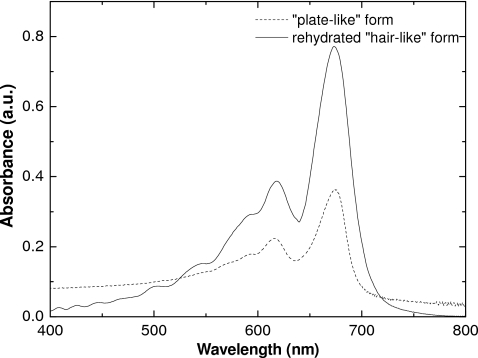
The effects of temperature on real time changes in optical density (DeltaOD) of GAFCHROMIC EBT film were investigated. The spectral peak of maximum change in absorbance (lambdamax) was shown to downshift linearly when the temperature of the film was increased from 22 to 38 degrees C. The DeltaOD values were also shown to decrease linearly with temperature, and this decrease could not be attributed to the shift in lambdamax. A compensation scheme using lambdamax and a temperature-dependent correction factor was investigated, but provided limited improvement. Part of the reason may be the fluctuations in hydration of the active component, which were found to affect both position of absorbance peaks and the sensitivity of the film. To test the effect of hydration, laminated and unlaminated films were desiccated. This shifted both the major and minor absorbance peaks in the opposite direction to the change observed with temperature. The desiccated film also exhibited reduced sensitivity to ionizing radiation. Rehydration of the desiccated films did not reverse the effects, but rather gave rise to another form of the polymer with absorbance maxima upshifted further 20 nm. Hence, the spectral characteristics and sensitivity of the film can be dependent on its history, potentially complicating both real-time and conventional radiation dosimetry.


Figures

Figure 1
Figure 1
Change in absorbance spectra for EBT film exposed to 1 Gy with 6 MV and 75 kVp beams. Each spectrum is an average of five spectra from five different films, with error bars representative of one standard deviation in measurement (1σ) at the given wavelength.
Figure 2
Figure 2
Picture and schematic of the modified phantom, with plastic water lines on either side of the film and optical fibers. The center axes of the water lines run parallel at 1.7 cm distance to the optical path, at 1.5 cm depth.
Figure 3
Figure 3
Wavelength of maximum absorbance of films irradiated to 1 Gy as a function of measured temperature. For this and subsequent figures, 6 MV photons beams were used. The λmax was tracked from a few seconds after the beginning of irradiation, through to its end. The error bars represent the standard deviation of λmax over this time interval. The line is the linear regression fit to data (R2=0.955).
Figure 4
Figure 4
Values of λmax for various doses as a function of measured temperature. The λmax was tracked from a few seconds after the beginning of irradiation through to the end. The error bars represent the standard deviation of λmax over this time interval.
Figure 5
Figure 5
Change in optical density for 1 Gy dose calculated for optical range of 630–640 nm, and an optical range of 10 nm centered about λmax, vs measured temperature. The line of best fit is plotted for ΔOD630–640 nm (R2=0.916) and is later used in a temperature correction scheme.
Figure 6
Figure 6
Temperature calculated using the position of λmax vs measured temperature, shown with a line of best fit. The error bar is a prediction error of 1σ.
Figure 7
Figure 7
Change in optical density for films irradiated to 1 Gy using a (◼) fixed optical integration range of 630–640 nm, (○) moving optical range of 10 nm about the peak of maximum change in absorbance, and (▲) as calculated using the peak of maximum absorbance and temperature-dependent correction factor. Solid lines are shown as a guide for the eye. Error bars indicate one standard deviation for the measured data and standard error (1σ) for calculated points, and the dashed line through the corrected ΔOD is the line of best fit (R2=0.029).
Figure 8
Figure 8
Normalized ΔOD (with respect to ΔOD at ∼23 °C) vs temperature for the real-time measurements, performed within 5 s after the end of irradiation. The data are shown both using the 630–640 nm range for ΔOD calculations (circles) and the 600–660 nm range (squares). Error bars represent 1σ of a single ΔOD measurement and error in temperature readout.
Figure 9
Figure 9
Normalized ΔOD of real-time measurements. The method of calculating ΔOD used in this article is shown with squares (◼); the method described by Reinstein et al. (Ref. 30) of predicting ΔOD measured by a densitometer or scanner is shown with circles (○). Error bars represent 1σ of a single ΔOD measurement and error in temperature readout.
Figure 10
Figure 10
Percent decrease in ΔODv for a 3 Gy dose, following different times in a desiccator at 50 °C.
Figure 11
Figure 11
Spectral comparisons of absorbance of desiccated and initial unlaminated EBT film.
Figure 12
Figure 12
Absorbance of unlaminated EBT film after time in desiccator at 50 °C (arbitrary dose, equivalent to about 10 Gy, but delivered using 254 nm UV light).
Figure 13
Figure 13
Spectral comparisons of absorbance of desiccated, rehydrated, and normal unlaminated EBT film irradiated to 3 Gy.
Figure 14
Figure 14
Absorbance spectra of exposed unlaminated films using plate-like form of polymer and the rehydrated form of hair-like polymer.

References

    1. Maryanski M. J., Ibbott G. S., Eastman P., Schulz R. J., and Gore J. C., “Radiation therapy dosimetry using magnetic resonance imaging of polymer gels,” Med. Phys. 10.1118/1.597717 23, 699–705 (1996). - DOI - PubMed
    1. Low D. A., Dempsey J. F., Venkatesan R., Mutic S., Markman J., Haacke E. M., and Purdy J. A., “Evaluation of polymer gels and MRI as a 3-D dosimeter for intensity modulated radiation therapy,” Med. Phys. 10.1118/1.598650 26, 1542–1551 (1999). - DOI - PubMed
    1. Berg A., Ertl A., and Moser E., “High resolution polymer gel dosimetry by parameter selective MR-microimaging on a whole body scanner at 3 T,” Med. Phys. 10.1118/1.1358304 28, 833–843 (2001). - DOI - PubMed
    1. Wuu C. S., Schiff P., Maryanski M. J., Liu T., Borzillary S., and Weinberger J., “Dosimetry study of Re-188 liquid balloon for intravascular brachytherapy using polymer gel dosimeters and laser-beam optical CT scanner,” Med. Phys. 10.1118/1.1533749 30, 132–137 (2003). - DOI - PubMed
    1. Oldham M., Siewerdsen J. H., Kumar S., Wong J., and Jaffray D. A., “Optical-CT gel dosimetry I: Basic investigations,” Med. Phys. 10.1118/1.1559835 30, 623–634 (2003). - DOI - PMC - PubMed

Publication types

LinkOut - more resources