. 2008 Oct 31:9:517.
doi: 10.1186/1471-2164-9-517.

A new method to compute K-mer frequencies and its application to annotate large repetitive plant genomes

Affiliations

A new method to compute K-mer frequencies and its application to annotate large repetitive plant genomes

Stefan Kurtz et al. BMC Genomics. .

Abstract

Background: The challenges of accurate gene prediction and enumeration are further aggravated in large genomes that contain highly repetitive transposable elements (TEs). Yet TEs play a substantial role in genome evolution and are themselves an important subject of study. Repeat annotation, based on counting occurrences of k-mers, has been previously used to distinguish TEs from low-copy genic regions; but currently available software solutions are impractical due to high memory requirements or specialization for specific user-tasks.

Results: Here we introduce the Tallymer software, a flexible and memory-efficient collection of programs for k-mer counting and indexing of large sequence sets. Unlike previous methods, Tallymer is based on enhanced suffix arrays. This gives a much larger flexibility concerning the choice of the k-mer size. Tallymer can process large data sizes of several billion bases. We used it in a variety of applications to study the genomes of maize and other plant species. In particular, Tallymer was used to index a set of whole genome shotgun sequences from maize (B73) (total size 109 bp.). We analyzed k-mer frequencies for a wide range of k. At this low genome coverage ( approximately 0.45x) highly repetitive 20-mers constituted 44% of the genome but represented only 1% of all possible k-mers. Similar low-complexity was seen in the repeat fractions of sorghum and rice. When applying our method to other maize data sets, High-C0t derived sequences showed the greatest enrichment for low-copy sequences. Among annotated TEs, the most highly repetitive were of the Ty3/gypsy class of retrotransposons, followed by the Ty1/copia class, and DNA transposons. Among expressed sequence tags (EST), a notable fraction contained high-copy k-mers, suggesting that transposons are still active in maize. Retrotransposons in Mo17 and McC cultivars were readily detected using the B73 20-mer frequency index, indicating their conservation despite extensive rearrangement across cultivars. Among one hundred annotated bacterial artificial chromosomes (BACs), k-mer frequency could be used to detect transposon-encoded genes with 92% sensitivity, compared to 96% using alignment-based repeat masking, while both methods showed 92% specificity.

Conclusion: The Tallymer software was effective in a variety of applications to aid genome annotation in maize, despite limitations imposed by the relatively low coverage of sequence available. For more information on the software, see http://www.zbh.uni-hamburg.de/Tallymer.


Figures

Figure 1
Figure 1
K-mer uniqueness ratio for the 0.45 × maize WGS data set for varying values ofk. The uniqueness ratio is the ratio of k-mers occurring exactly once relative to all k-mers in the set. k = 20 balances the information content with k-mer resolution, visible as a natural inflection point on the curve which may change with organism, sequencing technology, and coverage employed.
Figure 2
Figure 2
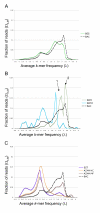
λ-distribution ratios for different classes of maize sequences. The X-axis shows the λ -values between λmin and λmin. The Y-axis shows the values for Ωk, M, where M is one of the first seven sequence sets from Table 1. Three sequence classes are shown: (A) Whole Genome Sequences, (B) Repeat Sequences, and (C) Gene Enrichment Sequences. The BAC profile is provided as a reference in all three panels. In (B) the two peaks in the bimodal distribution of the RepI curve are marked by the numbers 1 and 2, see also Table 2.
Figure 3
Figure 3
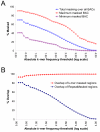
Comparison of masking using either k-mer frequencies or alignment-based repeat masking. (A) Percent of nucleotides masked in 100 BAC sequences (total length 14.3 Mb) as a function of absolute frequency threshold (logarithmic scale). Values are given for the sum of all sequences, and for the most and least repetitive BACs within the set. (B) Overlap between regions masked using the k-mer frequency based method and those masked using RepeatMasker (MIPS REcat library).
Figure 4
Figure 4
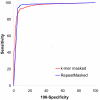
ROC plots showing sensitivity and specificity of TE detection among 2145 FGENESH models (1824 TE and 303 presumed genes) based on the percent of coding sequence masked using two methods. In one method BAC sequences were masked using an absolute frequency threshold of 0.8. In the other, masking was performed using RepeatMasker with the MIPS REcat library. ROC plot comparison of the maximum area under the curve resulting from the two plots showed that they are not significantly different (see main text for details).
Figure 5
Figure 5
Visualization of k-mer frequencies in a 453 kbp assembly of four BAC sequences derived from maize chromosome 8. A 100 kbp segment (range 70,001–170,000 nt) is shown. In the first two tracks transposable elements are shown in red while genes are shown in blue (exon/intron structure not shown). The third track, global k-mer frequency (GKF), shows for each position of the mentioned region (X-axis) the average frequencies λ(k, v, S) (Y-axis) of the k-mer v beginning at this position. Here S is the 0.45 × WGS set mentioned above. The fourth track, local k-mer frequency (LKF), shows λ(k, v, R), where R is the larger 453 kbp region under scrutiny. RepeatMasker results using the MIPS REcat repeat libraries are given alongside sequence masked using absolute frequency thresholds of 1, 2, and 3. Three genes (boxed) related to a selenium binding protein apparently arose by tandem duplication and have high LKF compared to other non-TE genes in the assembly.
Figure 6
Figure 6
Occurrence ratios in comparative genomics. Maize, sorghum and rice whole genome shotgun reads were randomly selected to generate 0.45 × coverage with respect to each genome's size. The total number of 20-mers in each logarithmic frequency class (A) are contrasted to the number of different 20-mers in each frequency class (B). Maize is the most repetitive of the three grasses analyzed here, but a corresponding increase in genome complexity is not observed.
Figure 7
Figure 7
The k-mer uniqueness ratio for some assembled plant genomes as a function of k. The uniqueness ratio is the ratio of k-mers occurring exactly once relative to all k-mers in the set. It is computed for every k between 10 and 500. Extrapolating beyond the tested k-mer interval, it appears as though poplar, rice, and grape approach unity at a much slower rate than arabidopsis.
Figure 8
Figure 8
K-mer frequencies across orthologous regions of three maize cultivars. The B73-based WGS index was used to annotate the Bronze-1 locus and surrounding regions in cultivars B73, McC and Mo17 (Genbank accession numbers AF448416, AF391808, and AY664416, respectively). Orthologous genes present in all three cultivars are connected with red lines. The Bronze-1 locus is shown with an asterisk. Helitrons HelA and HelB in McC, were previously described by [45]. Ty1/copia retrotransposons are shown in red while those of the Ty3/gypsy class are shown in yellow, as classified using MIPS REcat masking. Though the transposition histories vary across the three cultivars, the frequency index can successfully be used to annotate the repeat regions in McC and Mo17.

References

    1. Doolittle WF, Sapienza C. Selfish genes, the phenotype paradigm and genome evolution. Nature. 1980;284:601–3. doi: 10.1038/284601a0. - DOI - PubMed
    1. Orgel LE, Crick FH. Selfish DNA: the ultimate parasite. Nature. 1980;284:604–7. doi: 10.1038/284604a0. - DOI - PubMed
    1. SanMiguel P, Gaut BS, Tikhonov A, Nakajima Y, Bennetzen JL. The paleontology of intergene retro-transposons of maize. Nat Genet. 1998;20:43–5. doi: 10.1038/1695. - DOI - PubMed
    1. SanMiguel PJ, Ramakrishna W, Bennetzen JL, Busso CS, Dubcovsky J. Transposable elements, genes and recombination in a 215-kb contig from wheat chromosome 5A(m) Funct Integr Genomics. 2002;2:70–80. doi: 10.1007/s10142-002-0056-4. - DOI - PubMed
    1. Sanz-Alferez S, SanMiguel P, Jin YK, Springer PS, Bennetzen JL. Structure and evolution of the Cinful retrotransposon family of maize. Genome. 2003;46:745–52. doi: 10.1139/g03-061. - DOI - PubMed

Publication types

Substances