. 2009 Jan 16;385(2):491-506.
doi: 10.1016/j.jmb.2008.10.029. Epub 2008 Oct 19.

Kinetic analysis of late steps of eukaryotic translation initiation

Affiliations

Kinetic analysis of late steps of eukaryotic translation initiation

Michael G Acker et al. J Mol Biol. .

Abstract

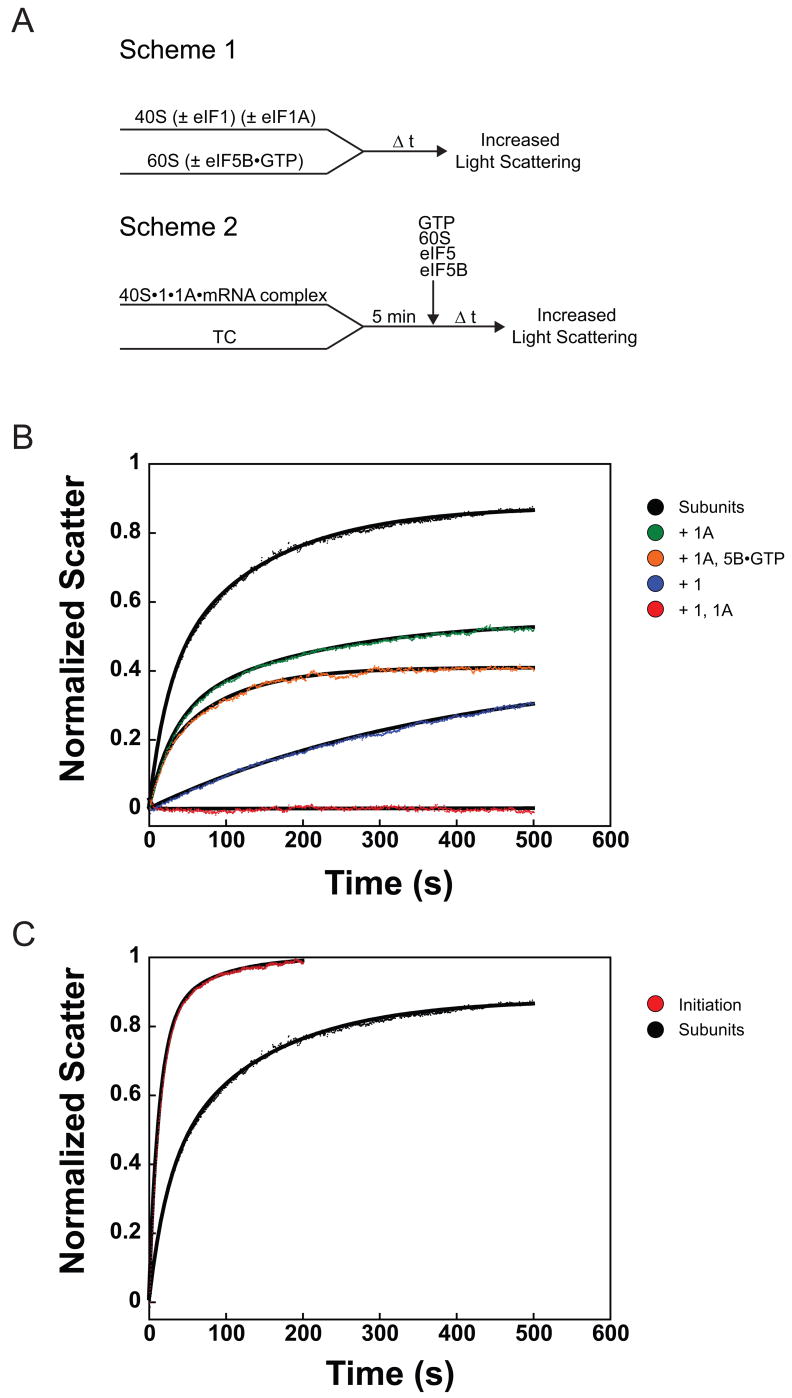
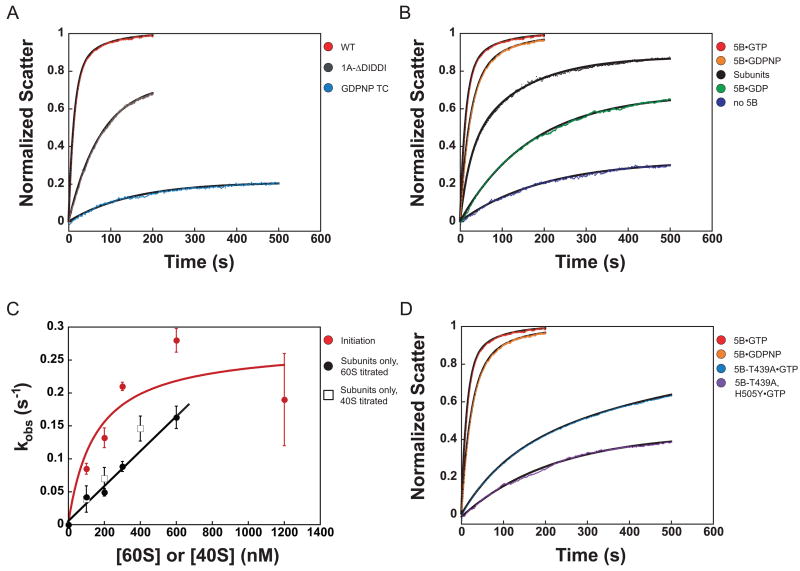
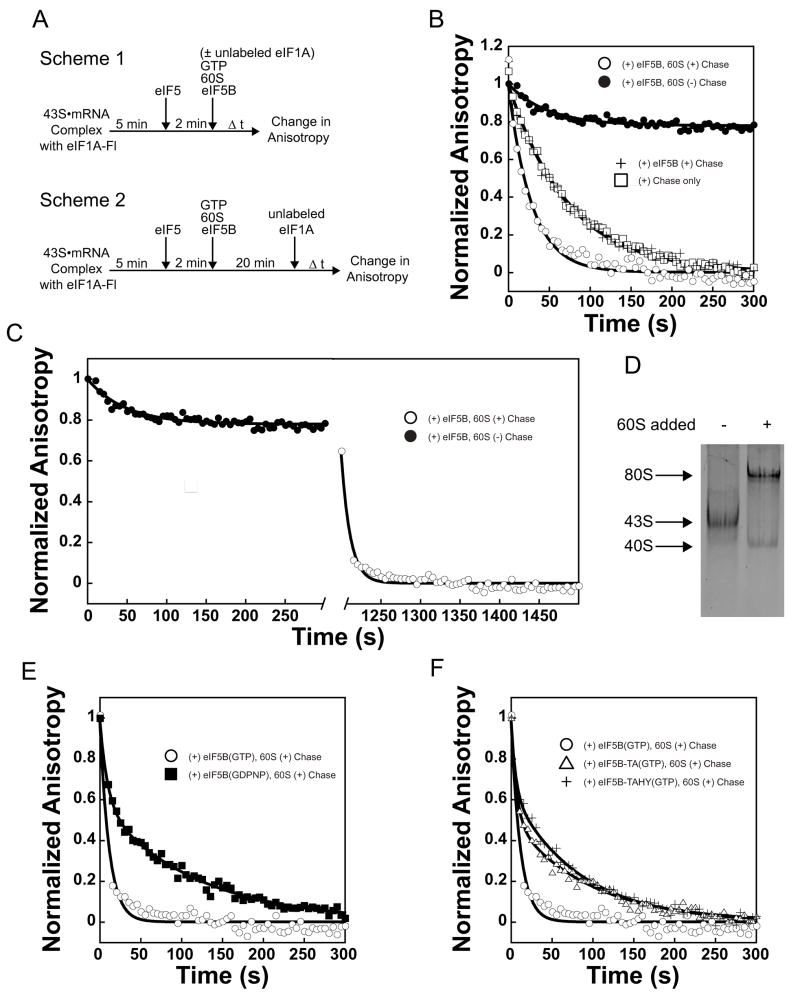
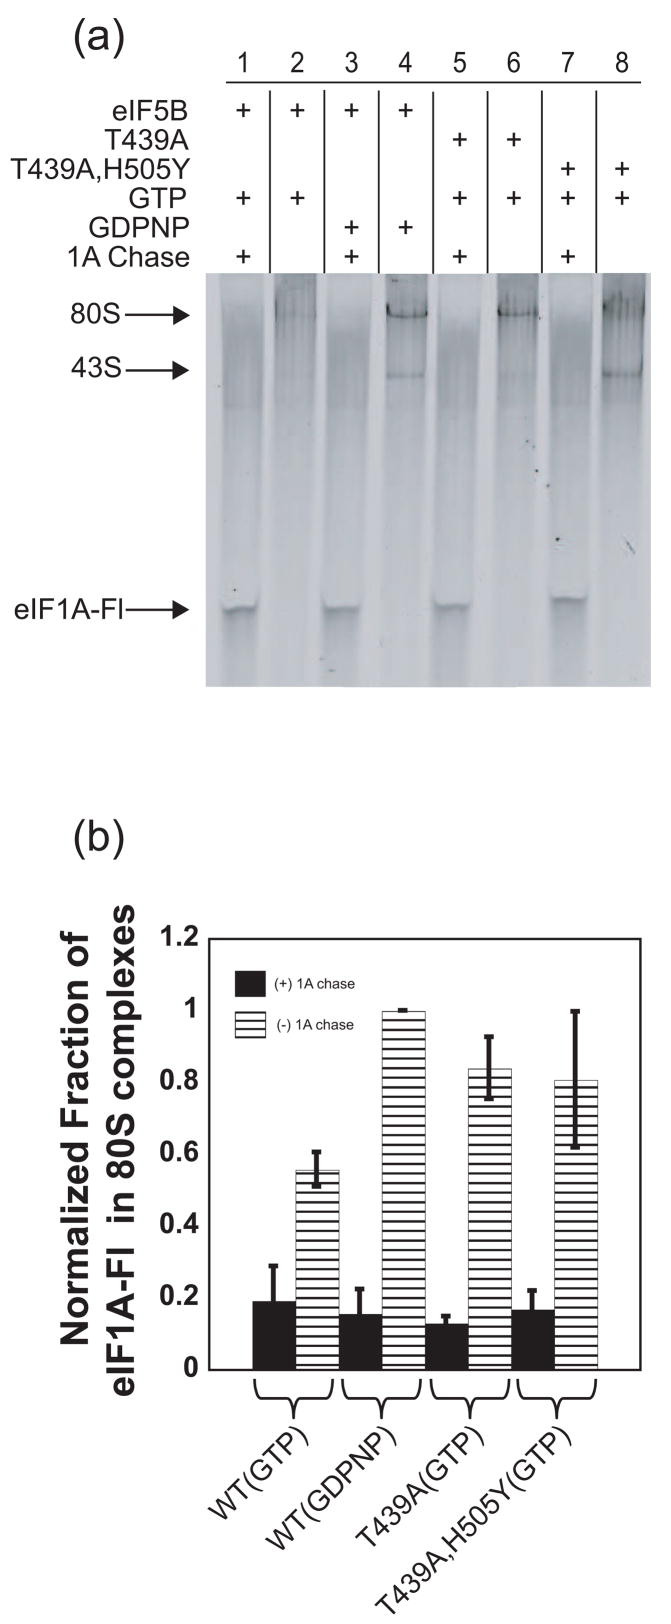
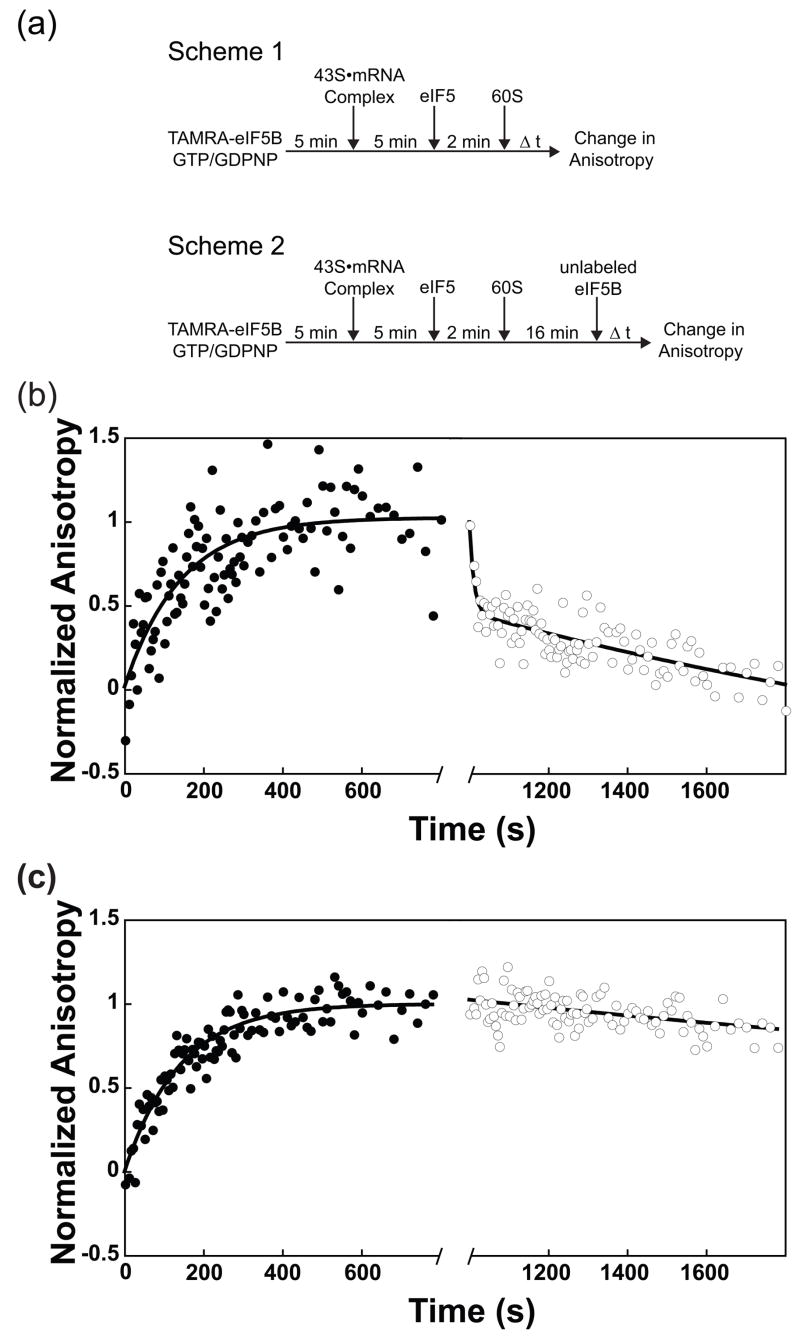
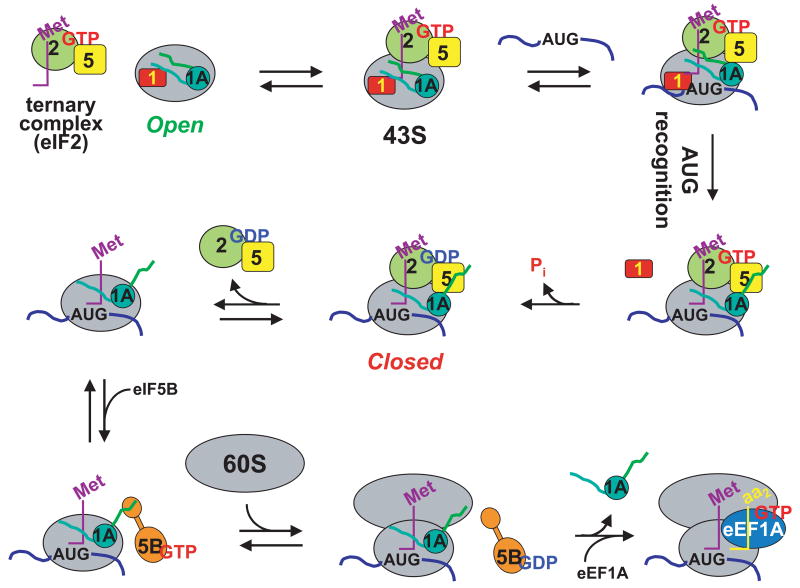
Little is known about the molecular mechanics of the late events of translation initiation in eukaryotes. We present a kinetic dissection of the transition from a preinitiation complex after start codon recognition to the final 80S initiation complex. The resulting framework reveals that eukaryotic initiation factor (eIF)5B actually accelerates the rate of ribosomal subunit joining, and this acceleration is influenced by the conformation of the GTPase active site of the factor mediated by the bound nucleotide. eIF1A accelerates joining through its C-terminal interaction with eIF5B, and eIF1A release from the initiating ribosome, which occurs only after subunit joining, is accelerated by GTP hydrolysis by eIF5B. Following subunit joining, GTP hydrolysis by eIF5B alters the conformation of the final initiation complex and clears a path to promote rapid release of eIF1A. Our data, coupled with previous work, indicate that eIF1A is present on the ribosome throughout the entire initiation process and plays key roles at every stage.


Figures

Figure 1
Figure 1
Ribosomal subunit joining within the initiation pathway and with naked ribosomal subunits monitored by light scattering. (a) Experimental designs. Scheme 1: Assembly of 80S ribosomes outside of the initiation pathway. Scheme 2: Assembly of 80S ICs. TC: eIF2•GTP•Met-tRNAi ternary complex. (b) Association of 40S and 60S ribosomal subunits alone and in the presence of eIF1 and/or eIF1A. Subunit joining with ribosomal subunits only (black): k1 = 0.042 ± 0.002 s−1, α1 = 0.37 ± 0.04, k2 = 0.007 ± 9×10⁻⁴ s−1, α2 = 0.51 ± 0.04. Plus eIF1A (green): k1 = 0.031 ± 0.002 s−1, α1 = 0.28 ± 0.02; k2 = 0.007 ± 0.001 s−1, α2 = 0.30 ± 0.04. Plus eIF1 (blue): k = 0.003 ± 6×10⁻⁴ s−1, α = 0.39 ± 0.06. In the presence of both eIF1 and eIF1A (red), subunit joining was completely prevented. Plus eIF1A and eIF5B•GTP (orange): k = 0.014 ± 0.001 s−1, α = 0.38 ± 0.01. (c) Initiation pathway-dependent ribosomal subunit joining (red): k1 = 0.076 ± 0.004 s−1, α1 = 0.77 ± 0.06, k2 = 0.019 ± 0.006 s−1, α2 = 0.23 ± 0.06. Joining of subunits alone (black) shown for comparison. Data are means ± average error. All amplitudes are normalized to subunit joining in the complete initiation system (C, red curve). In all experiments the 40S and 60S concentrations were 50 and 100 nM, respectively.
Figure 2
Figure 2
The initiation pathway accelerates ribosomal subunit joining relative to the intrinsic rate in the absence of factors. (a) Prior steps in the initiation pathway are required for optimal subunit joining. Subunit joining with GDPNP in TC (blue): k = 0.007 ± 0.001 s−1, α = 0.21 ± 0.01. 43S•mRNA complex containing eIF1A-ΔDIDDI (gray): k = 0.013 ± 0.001 s−1, α = 0.76 ± 0.01. Both are fit to single exponentials. Subunit joining in the complete initiation pathway (red) is shown for comparison. (b) The nucleotide state of eIF5B influences subunit joining. Subunit joining with subunits only (black) and in the translation initiation pathway (red), as described above. In the absence of eIF5B (blue), kobs = 0.005 ± 8×10⁻⁴ s−1, α = 0.29 ± 0.02. eIF5B•GDP (green): k = 0.006 ± 6×10⁻⁴ s−1, α = 0.64 ± 0.02. eIF5B•GDPNP (orange): k1 = 0.044 ± 0.001 s−1, α1 = 0.7 ± 0.03; k2 = 0.013 ± 0.003 s−1, α2 = 0.27 ± 0.03. (c) kobs for subunit joining vs. concentration of 40S or 60S subunits. When only ribosomal subunits are present, kobs increases linearly with 40S (open squares) or 60S (solid circles) concentration in the range tested (slope = 2.5×10⁵ M−1 s−1). When subunit joining occurs in the context of the initiation pathway, kobs varies in a manner best fit by a hyperbola (red; kmax = 0.3 s−1; K1/2 = 150 nM). Data are represented as mean ± average error. (d) GTPase-deficient eIF5B mutants slow subunit joining. eIF5B-T439A•GTP (light blue): k1= 0.008 ± 9×10⁻⁴, α1=0.34 ± 0.05, k2= 0.001 ± 3×10⁻⁴, α2=0.52 ± 0.02. eIF5B-T439A, H505Y•GTP (purple): kobs = 0.004 ± 3×10⁻⁴, α = 0.48 ± 0.03. eIF5B•GTP (red) and eIF5B•GDPNP (orange) are shown for comparison.
Figure 3
Figure 3
eIF1A is present in 80S complexes and its dissociation is accelerated by GTP hydrolysis by eIF5B. (a) Experimental designs. Scheme 1: Assembly of 80S ICs with or without chase of excess unlabeled eIF1A included with 60S subunits. Scheme 2: Assembly of 80S ICs followed by chase of excess unlabeled eIF1A. (b) Measuring the rate constants for dissociation of eIF1A-Fl from post-AUG-recognition 43S•mRNA complexes. Anisotropy of eIF1A-Fl in the absence of other factors: rfree = 0.1526 ± 3.5 × 10⁻³; in 43S•mRNA•eIF5 complexes: r43S = 0.2075 ± 7.4 × 10⁻³. Addition of eIF1A chase without eIF5B or 60S subunits (□): k = 0.013 ± 0.001 s−1. Addition of eIF1A chase with eIF5B (+): 0.012 ± 0.001 s−1. Addition of eIF1A chase with both eIF5B and 60S subunits (○): k = 0.034 ± 0.001 s−1. When eIF5B and 60S subunits are added in the absence of chase, eIF1A dissociates only slightly (k = 0.03 ± 0.01, = 0.25 ± 0.06, ●). (c) Fluorescence anisotropy change of eIF1A-Fl during formation of 80S ICs (●, as in Figure 4(b)), and with addition of unlabeled eIF1A chase after 20 minutes (○): kobs > 0.09 s−1; dead time of the experimental set-up. Anisotropy of eIF1A-Fl bound to 80S complexes formed with eIF5B•GTP: r80S-5B•GTP = 0.1969 ± 6.8 × 10⁻³. (d) Fluorescence scan of a native gel showing eIF1A-Fl binds to 43S•mRNA complexes and 80S complexes. 80S complexes were formed with eIF5B•GDPNP. Formation of 80S ICs also results in the appearance of a band corresponding to eIF1A-Fl bound to free 40S subunits. (e) eIF1A-Fl dissociates with biphasic kinetics from complexes formed with eIF5B•GDPNP (k1 ≥0.14; α1 = 0.40 ± 0.03; k2= 0.0085 ± 3 × 10⁻⁵; α2 = 0.6 ± 0.03, ■). The first phase most likely represents dissociation from the 40S subunits produced in reactions in which 80S ICs are formed (Fig. 3d). Dissociation of eIF1A-Fl from ICs formed with eIF5B•GTP (○) is shown for comparison. Anisotropy of eIF1A-Fl bound to 80S complexes formed with eIF5B•GDPNP: r80S-5B•GDPNP = 0.2159 ± 1.2 × 10⁻³. (f) GTPase-deficient eIF5B-T439A•GTP (△) slows eIF1A-Fl dissociation from 80S ICs relative to WT eIF5B (k1 ≥0.16, α1 = 0.47 ± 0.03; k2 = 0.011 ± 5 × 10⁻⁴ s−1; α2 = 0.53 ± 0.03; WT eIF5B-GTP, ○). Second-site suppressor mutant eIF5B-T439A, H505Y•GTP does not restore the rate of eIF1A-Fl dissociation relative to eIF5B-T439A (k1 ≥0.18, α1= 0.31 ± 0.05; k2 = 0.012 ± 5 × 10⁻⁴ s−1, α2 = 0.69 ± 0.06; +). Anisotropy of eIF1A-Fl bound to 80S complexes formed with eIF5B-TA•GTP: r80S-5B-TA•GTP = 0.2175 ± 1.4 × 10⁻³; formed with eIF5B-TAHY•GTP: r80S-5B-TAHY•GTP = 0.2210 ± 3.5 × 10⁻³. Data are represented as mean ± average error.
Figure 4
Figure 4
eIF1A-Fl in ICs can be visualized directly in native gels. (a) Fluorescence scan of native gel showing eIF1A-Fl bound to 80S ICs formed in the presence of WT or mutant eIF5B bound to GTP or GDPNP, with or without the addition of excess unlabeled eIF1A chase. Thirty-minute time points are shown and the positions of 43S and 80S complexes are noted. (b) Quantification of the bands in (a). Data in (b) are represented as the mean of three independent experiments ± average error.
Figure 5
Figure 5
eIF5B binding to and release from initiating ribosomal complexes. (a) Scheme 1: Experimental setup to measure the kinetics of TAMRA-labeled eIF5B binding to ribosomal complexes during initiation. Scheme 2: Experimental setup to measure the kinetics of release of TAMRA-eIF5B from the 80S IC following subunit joining. (b) Kinetics of TAMRA-eIF5B•GTP binding to ribosomal complexes during subunit joining. The fluorescence anisotropy of TAMRA-eIF5B•GTP increases during the formation of 80S ICs with a rate constant of 0.009 ± 0.002 s−1 (●). Addition of excess unlabeled eIF5B 16 minutes after initiation of 80S complex formation results in biphasic dissociation of TAMRA-eIF5B from 80S ICs (k1 = 0.12 ± 0.02 s−1, α1 = 0.47 ± 0.03, k2 = 0.0025 ± 5 × 10⁻⁴ s−1, α2 = 0.54 ± 0.035; ○). Anisotropy of TAMRA-eIF5B•GTP in the absence of other factors: rfree = 0.2353 ± 1.1 × 10⁻³; in 80S complexes: rbound = 0.2408 ± 1.8 × 10⁻³. (c) Kinetics of TAMRA-eIF5B•GDPNP binding to 80S ribosomal complexes during subunit joining. The fluorescence anisotropy of TAMRA-eIF5B•GDPNP increases upon initiation of subunit joining similarly to GTP-bound TAMRA-eIF5B, with a rate constant of 0.0073 ± 5 × 10⁻⁵ s−1 (●). However, the rate constant for dissociation of TAMRA-eIF5B•GDPNP from the resulting 80S complexes upon addition of excess unlabeled eIF5B is reduced ~750-fold (k = 1.6 × 10⁻⁴ ± 2 × 10⁻⁵ s−1; ○). Dissociation of TAMRA-eIF5B•GDPNP was carried out for ~ 4 hours. Plotted data are truncated for clarity, however reported rate constants were determined by fitting the entire data set. Anisotropy of TAMRA-eIF5B•GDPNP in the absence of other factors: rfree = 0.2357 ± 5 × 10⁻⁴; in 80S complexes: rbound = 0.2440 ± 1.8 × 10⁻³. Data are represented as mean ± average error.
Figure 6
Figure 6
Simplified model of eukaryotic translation initiation: eIF1A is a central organizer of events in the pathway. eIF1A binds to the 40S ribosomal subunit cooperatively with eIF1, inducing a structural change in the subunit resulting in an ‘open’ state that can rapidly bind the eIF2•GTP•Met-tRNAi ternary complex (TC) and is highly resistant to subunit joining. In the open state, the 43S complex binds near the 5′.-end of an mRNA and begins to scan in search of the AUG start codon. Start codon recognition results in formation of a direct or indirect interaction between eIF1A and eIF5. The affinity of eIF1 for the initiating ribosome is reduced upon start codon recognition, leading to the factor’s release from the complex. eIF1 dissociation triggers Pi release from eIF2, making GTP hydrolysis irreversible, and also causes the complex to revert to a closed state. eIF2•GDP has reduced affinity for the initiating ribosome and, presumably together with eIF5, transiently dissociates, leaving the C-terminus of eIF1A free to interact with eIF5B. In its GTP-bound form, eIF5B facilitates subunit joining, and GTP hydrolysis results in dissociation of the factor from the resulting 80S IC. Subunit joining and subsequent GTP hydrolysis by eIF5B trigger eIF1A to vacate the 80S IC, freeing the A site of the 80S ribosome to bind to eukaryotic elongation factor (eEF) 1A•GTP•aminoacyl-tRNA ternary complexes, thus beginning the elongation phase of translation.

References

    1. Laursen BS, Sorensen HP, Mortensen KK, Sperling-Petersen HU. Initiation of protein synthesis in bacteria. Microbiol Mol Biol Rev. 2005;69:101–23. - PMC - PubMed
    1. Kapp LD, Lorsch JR. The molecular mechanics of eukaryotic translation. Annu Rev Biochem. 2004;73:657–704. - PubMed
    1. Pestova TV, Lorsch JR, Hellen CUT. The Mechanism of Eukaryotic Translation Initiation in Eukaryotes. In: Mathews MB, Sonenberg N, Hershey JWB, editors. Translational Control in Biology and Medicine. Cold Spring Harbor Laboratory Press; Cold Spring Harbor, NY: 2007. pp. 87–128.
    1. Thomas A, Spann W, Van Steeg H, Voorma HO, Benne R. Mode of action of protein synthesis initiation factor eIF-1 from rabbit reticulocytes. FEBS Lett. 1980;116:67–71. - PubMed
    1. Thomas A, Goumans H, Voorma HO, Benne R. The mechanism of action of eukaryotic initiation factor 4C in protein synthesis. Eur J Biochem. 1980;107:39–45. - PubMed

Publication types

MeSH terms

LinkOut - more resources