. 2009 Jan 23;158(2):896-903.
doi: 10.1016/j.neuroscience.2008.10.004. Epub 2008 Oct 7.

The contributing role of CD14 in toll-like receptor 4 dependent neuropathic pain

Affiliations

The contributing role of CD14 in toll-like receptor 4 dependent neuropathic pain

L Cao et al. Neuroscience. .

Abstract

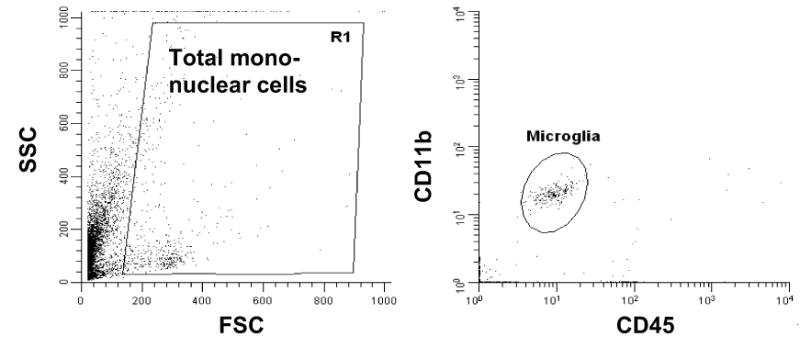
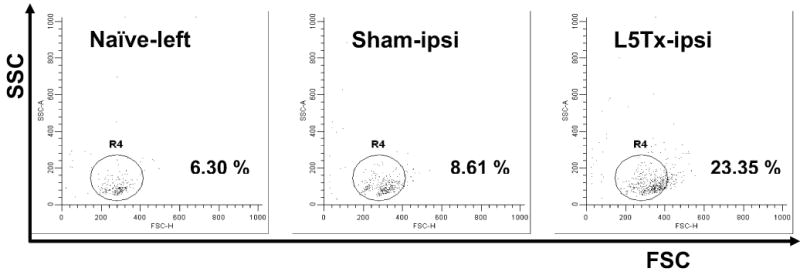
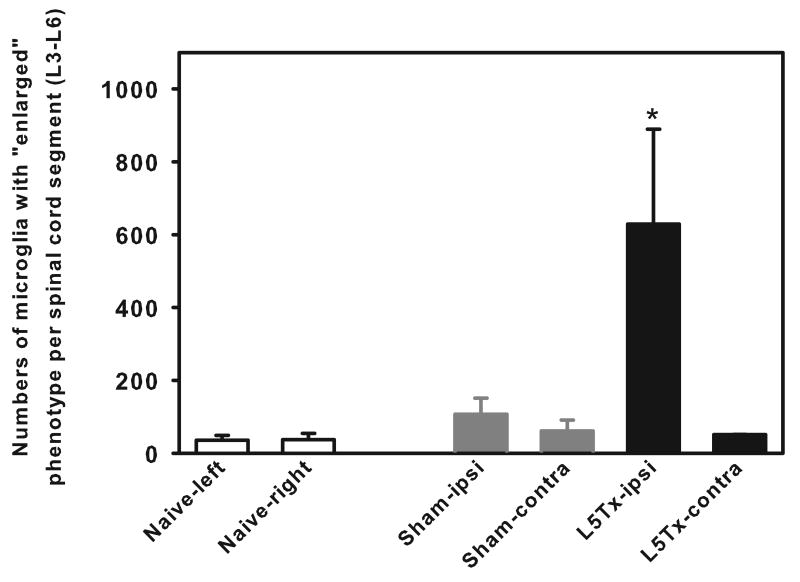
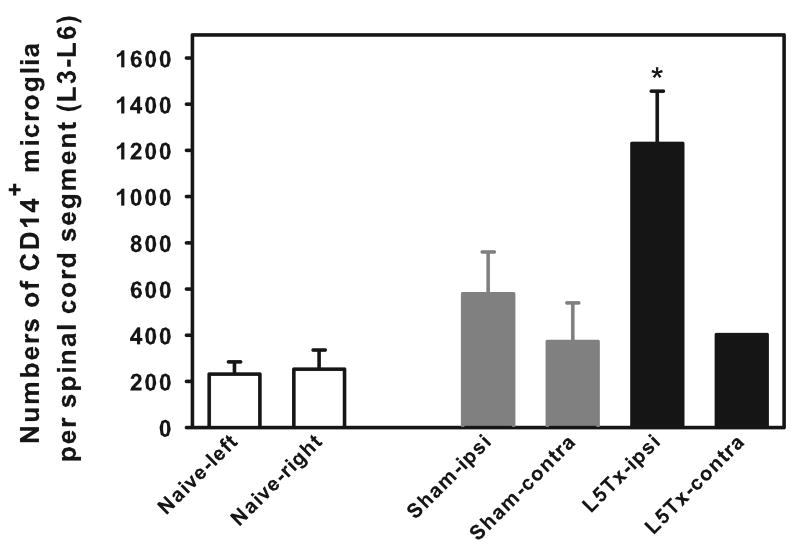
We have previously demonstrated that CNS toll-like receptor 4 (TLR4) plays a key role in the development of behavioral hypersensitivity in a rodent model of neuropathic pain, spinal nerve L5 transection (L5Tx). TLR4 is a well-known receptor for lipopolysaccharide (LPS) in innate immune responses. In the current study, we further investigated the role of CD14, an accessory molecule in the LPS-TLR4 signaling pathway, in the development of L5Tx-induced neuropathic pain. CD14 knockout (KO) mice displayed significantly decreased behavioral sensitivity (mechanical allodynia and thermal hyperalgesia) as early as day 1 post-L5Tx, indicating a nociceptive role of CD14. By flow cytometric analyses, we observed significantly elevated microglial surface CD14 expression in the ipsilateral lumbar spinal cord 3 days post-L5Tx, as well as remarkable increases in microglial size (via forward scatter (FSC)) and granularity (via side scatter (SSC)). Further, intrathecal injection of soluble CD14 induced significantly greater mechanical hypersensitivity in wild type (C3H/HeN) mice compared with TLR4-deficient (C3H/HeJ) mice. Together, these data demonstrate that CD14 plays a contributing role in TLR4-dependent nerve injury-induced neuropathic pain.


Figures

Figure 1
Figure 1. Behavioral sensitivity of CD14 KO mice
CD14 KO mice on the C57BL/6 background and wild type control mice were subjected to either L5Tx or sham surgery. All mice were tested for mechanical allodynia with von Frey filaments (A), thermal hyperalgesia using both the Hargreaves test (B) and the tail flick test (C). Data are presented as mean ± SEM. Numbers of animals used in each group are indicated in the graph (n). Significant differences (p < 0.05 via post-hoc test) between the “CD14 mice-L5Tx” and “C57BL/6-L5Tx” groups at each time point are indicated with *. # indicates the significant differences (p < 0.05 via post-hoc test) between “CD14 mice-L5Tx” and “CD14 mice-Sham” groups at each time point.
Figure 2
Figure 2. Identification of lumbar spinal cord microglia post-L5Tx
C57BL/6 mice were subjected to either L5Tx or sham surgery. Mononuclear cells from lumbar spinal cord of pooled animals (4 mice per sample group) were collected 3 days post-surgery and analyzed by flow cytometry with mAbs against CD45, CD11b and CD14. Figure 2 presents the changes of total lumbar spinal cord microglia (other parameters presented in Figure 3 and 4 respectively). Representative dot plots from flow cytometric analyses are shown in A: left panel – SSC vs. FSC dot plot showing total collected lumbar spinal cord mononuclear cells from naive mice, which is indicated in the R1 region; right panel – gated on R1 region, CD11b vs. CD45 dot plot showing CD45loCD11b+ microglia (in the circled region) from the same mice. Numbers of total lumbar spinal cord microglia per mouse were calculated (from three independent experiments) and are shown in B. Data are presented as mean ± SEM. + denotes the significant differences between the indicated groups via t-test, p < 0.05. ipsi = ipsilateral side and contra = contralateral side.
Figure 3
Figure 3. “Morphological” phenotype of lumbar spinal cord microglia post-L5Tx
Mononuclear cells were collected from lumbar spinal cord of pooled animals and analyzed by flow cytometry as described in Figure 2. Representative SSC vs. FSC dot plots of identified CD45loCD11b+ microglia (as described in Figure 2A right panel) from selected groups (from left to right) – naïve-left, day 3 sham-ipsi, and day 3 L5Tx-ipsi are shown in A. Microglia from naïve animals are contained mostly in the circle R4. Microglia outside circle R4 express both increased granularity and size compared to the cells within R4, so called with “enlarged” phenotype. Average percentage of “enlarged” microglia in total microglia of each group is presented within each plot. Numbers of total “enlarged” microglia per mouse were calculated (from three independent experiments) and are shown in B. Data are presented as mean ± SEM. * indicates the significant differences between the “L5Tx-ipsi” group and all other groups via post-hoc test, p < 0.05. ipsi = ipsilateral side and contra = contralateral side.
Figure 4
Figure 4. CD14 expression of lumbar spinal cord microglia post-L5Tx
Mononuclear cells were collected from lumbar spinal cord of pooled animals and analyzed by flow cytometry as described in Figure 2. Representative CD11b vs. CD14 dot plots of identified CD45loCD11b+ microglia (as described in Figure 2A right panel) are shown in A: left panel – microglial cells without CD14 staining (i.e. CD45 and CD11b staining only) and right panel – microglia from ipsilateral side of L5Tx mice with CD14 staining. CD14+ microglia are shown in the rectangular region. Numbers of total CD14+ microglia per mouse were calculated (from three independent experiments) and are shown in B. Data are presented as mean ± SEM. * indicates the significant differences between “L5Tx-ipsi” group and all other groups via post-hoc test, p < 0.05. ipsi = ipsilateral side and contra = contralateral side.
Figure 5
Figure 5. Mechanical sensitivity of TLR4 mutant mice post-CD14 injection
Tactile mechanical sensitivity was determined in both C3H/HeJ mice (TLR4 deficient, in grey) and the wild type control mice (C3H/HeN in white) 1 hr following intrathecal (i.t.) administration of either CD14-human IgG Fc fusion protein (labeled as CD14) or human IgG Fc (labeled as IgG) (both at 500 ng / 5 μl / mouse). Baseline mechanical sensitivities of each strain of mice were assessed and all available data are shown here (Naïve). Numbers of animals for each group are the following, in C3H/HeN mice: Naïve group - 42, IgG treated group - 13, and CD14 treated group - 9; in C3H/HeJ mice: Naïve group - 30, IgG treated group - 4, and CD14 treated group - 9. All data are presented as mean ± SEM. As positive controls, mice from each strain were i.t. injected with 10 μg of LPS and tested 1 hr post-injection (n = 1 for C3H/HeN mice and n = 2 for C3H/HeJ mice). Statistical analysis was performed using all experimental groups (not including LPS groups). # indicates significant differences between the indicated group and all other groups via post-hoc test; * indicates the significant differences between indicated group and the naïve group of the same mouse strain via post-hoc test; p < 0.05.

References

    1. Abbadie C, Lindia JA, Cumiskey AM, Peterson LB, Mudgett JS, Bayne EK, DeMartino JA, MacIntyre DE, Forrest MJ. Impaired neuropathic pain responses in mice lacking the chemokine receptor CCR2. Proc Natl Acad Sci U S A. 2003;100:7947–7952. - PMC - PubMed
    1. Aravalli RN, Peterson PK, Lokensgard JR. Toll-like receptors in defense and damage of the central nervous system. J Neuroimmune Pharmacol. 2007;2:297–312. - PubMed
    1. Bas S, Gauthier BR, Spenato U, Stingelin S, Gabay C. CD14 Is an Acute-Phase Protein. J Immunol. 2004;172:4470–4479. - PubMed
    1. Cao L, DeLeo JA. CNS-infiltrating CD4+ T lymphocytes contribute to murine spinal nerve transection-induced neuropathic pain. Eur J Immunol. 2008;38:448–458. - PMC - PubMed
    1. Cauwels A, Frei K, Sansano S, Fearns C, Ulevitch R, Zimmerli W, Landmann R. The Origin and Function of Soluble CD14 in Experimental Bacterial Meningitis. J Immunol. 1999a;162:4762–4772. - PubMed

Publication types

MeSH terms