Resonance frequencies of lipid-shelled microbubbles in the regime of nonlinear oscillations
- PMID: 18977009
- PMCID: PMC2807701
- DOI: 10.1016/j.ultras.2008.09.006
Resonance frequencies of lipid-shelled microbubbles in the regime of nonlinear oscillations
Abstract
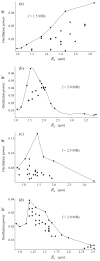
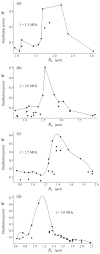
Knowledge of resonant frequencies of contrast microbubbles is important for the optimization of ultrasound contrast imaging and therapeutic techniques. To date, however, there are estimates of resonance frequencies of contrast microbubbles only for the regime of linear oscillation. The present paper proposes an approach for evaluating resonance frequencies of contrast agent microbubbles in the regime of nonlinear oscillation. The approach is based on the calculation of the time-averaged oscillation power of the radial bubble oscillation. The proposed procedure was verified for free bubbles in the frequency range 1-4 MHz and then applied to lipid-shelled microbubbles insonified with a single 20-cycle acoustic pulse at two values of the acoustic pressure amplitude, 100 kPa and 200 kPa, and at four frequencies: 1.5, 2.0, 2.5, and 3.0 MHz. It is shown that, as the acoustic pressure amplitude is increased, the resonance frequency of a lipid-shelled microbubble tends to decrease in comparison with its linear resonance frequency. Analysis of existing shell models reveals that models that treat the lipid shell as a linear viscoelastic solid appear may be challenged to provide the observed tendency in the behavior of the resonance frequency at increasing acoustic pressure. The conclusion is drawn that the further development of shell models could be improved by the consideration of nonlinear rheological laws.
Figures


Similar articles
-
Modeling of nonlinear viscous stress in encapsulating shells of lipid-coated contrast agent microbubbles.Ultrasonics. 2009 Feb;49(2):269-75. doi: 10.1016/j.ultras.2008.09.007. Epub 2008 Sep 30. Ultrasonics. 2009. PMID: 18990417 Free PMC article.
-
Interaction of an ultrasound-activated contrast microbubble with a wall at arbitrary separation distances.Phys Med Biol. 2015 Oct 21;60(20):7909-25. doi: 10.1088/0031-9155/60/20/7909. Epub 2015 Sep 25. Phys Med Biol. 2015. PMID: 26407104
-
Nonlinear resonance behavior and linear shell estimates for Definity™ and MicroMarker™ assessed with acoustic microbubble spectroscopy.J Acoust Soc Am. 2013 Feb;133(2):1158-68. doi: 10.1121/1.4774379. J Acoust Soc Am. 2013. PMID: 23363132
-
Bubble dynamics involved in ultrasonic imaging.Expert Rev Mol Diagn. 2006 May;6(3):493-502. doi: 10.1586/14737159.6.3.493. Expert Rev Mol Diagn. 2006. PMID: 16706749 Review.
-
Ultrasound contrast microbubbles in imaging and therapy: physical principles and engineering.Phys Med Biol. 2009 Mar 21;54(6):R27-57. doi: 10.1088/0031-9155/54/6/R01. Epub 2009 Feb 19. Phys Med Biol. 2009. PMID: 19229096 Free PMC article. Review.
Cited by
-
Design factors of intravascular dual frequency transducers for super-harmonic contrast imaging and acoustic angiography.Phys Med Biol. 2015 May 7;60(9):3441-57. doi: 10.1088/0031-9155/60/9/3441. Epub 2015 Apr 9. Phys Med Biol. 2015. PMID: 25856384 Free PMC article.
-
Resonance behaviors of encapsulated microbubbles oscillating nonlinearly with ultrasonic excitation.Ultrason Sonochem. 2023 Mar;94:106334. doi: 10.1016/j.ultsonch.2023.106334. Epub 2023 Feb 15. Ultrason Sonochem. 2023. PMID: 36805411 Free PMC article.
-
Dispersing and Sonoporating Biofilm-Associated Bacteria with Sonobactericide.Pharmaceutics. 2022 May 30;14(6):1164. doi: 10.3390/pharmaceutics14061164. Pharmaceutics. 2022. PMID: 35745739 Free PMC article.
-
Modifying the size distribution of microbubble contrast agents for high-frequency subharmonic imaging.Med Phys. 2013 Aug;40(8):082903. doi: 10.1118/1.4813017. Med Phys. 2013. PMID: 23927358 Free PMC article.
-
Cavitation Characterization of Size-Isolated Microbubbles in a Vessel Phantom Using Focused Ultrasound.Pharmaceutics. 2022 Sep 12;14(9):1925. doi: 10.3390/pharmaceutics14091925. Pharmaceutics. 2022. PMID: 36145673 Free PMC article.
References
-
- Rychak JJ, Klibanov AL, Ley KF, Hossack JA. Enhanced targeting of ultrasound contrast agents using acoustic radiation force. Ultrasound Med Biol. 2007;33:1132–1139. - PubMed
-
- Shortencarier MJ, Dayton PA, Bloch SH, Schumann PA, Matsunaga TO, Ferrara KW. A method for radiation-force localized drug delivery using gas-filled lipospheres. IEEE Trans Ultrason Ferroelectr Freq Contr. 2004;51:822–831. - PubMed
-
- Chomas J, Dayton P, May D, Ferrara K. Nondestructive subharmonic imaging. IEEE Trans Ultrason Ferroelectr Freq Contr. 2002;49:883–892. - PubMed
-
- de Jong N, Frinking PJ, Bouakaz A, Ten Cate FJ. Detection procedures of ultrasound contrast agents. Ultrasonics. 2000;38:87–92. - PubMed
Publication types
MeSH terms
Substances
Grants and funding
LinkOut - more resources
Full Text Sources
Other Literature Sources

