. 2008 Nov 4;14(5):355-68.
doi: 10.1016/j.ccr.2008.10.001.

H3K79 methylation profiles define murine and human MLL-AF4 leukemias

Affiliations

H3K79 methylation profiles define murine and human MLL-AF4 leukemias

Andrei V Krivtsov et al. Cancer Cell. .

Abstract

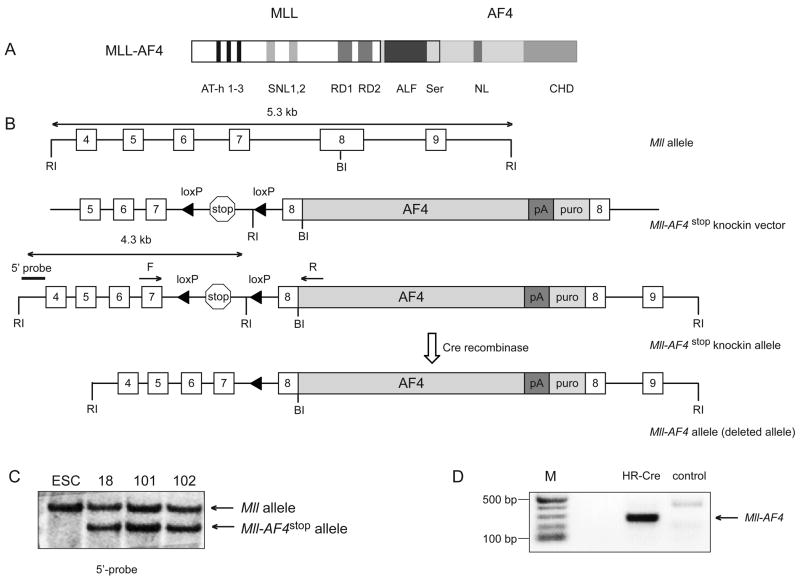
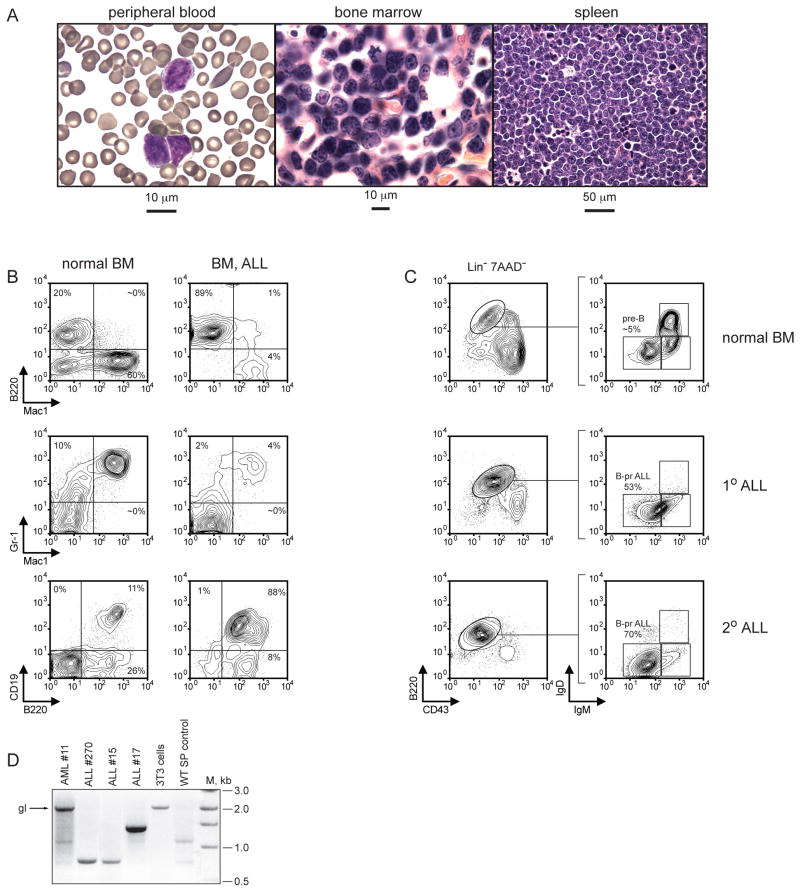
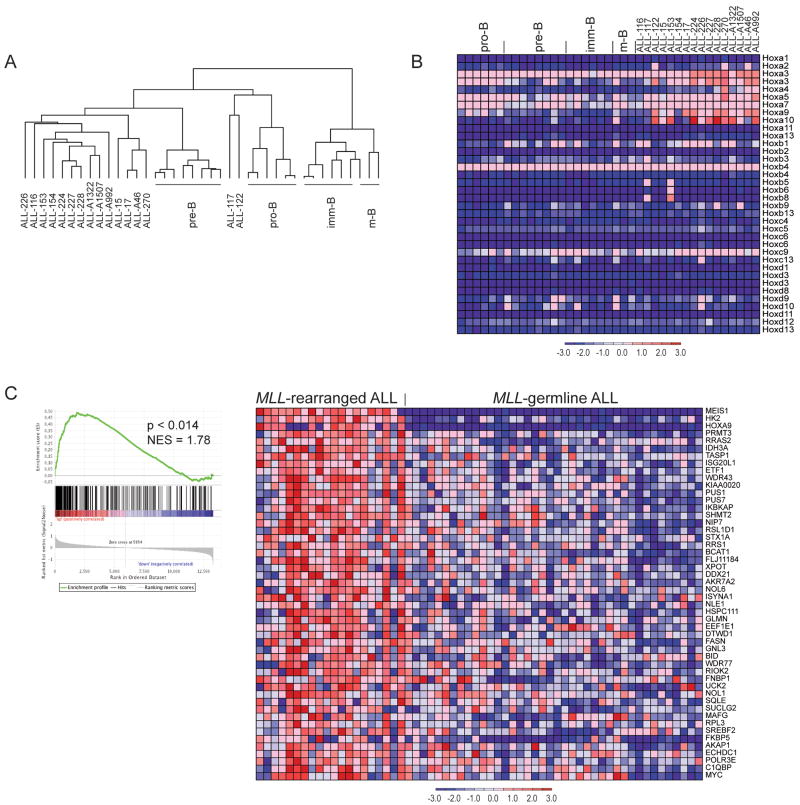
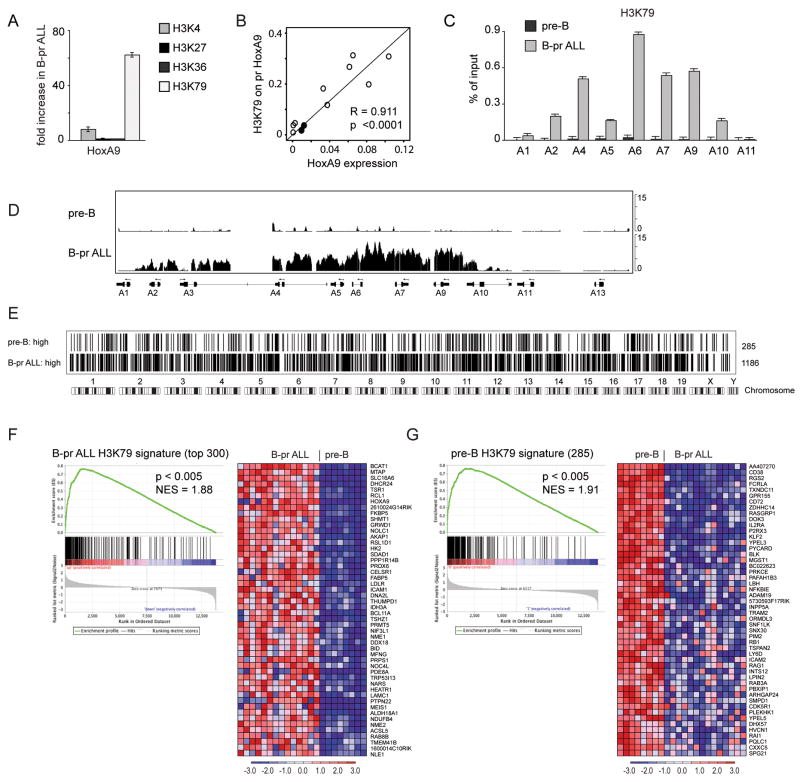
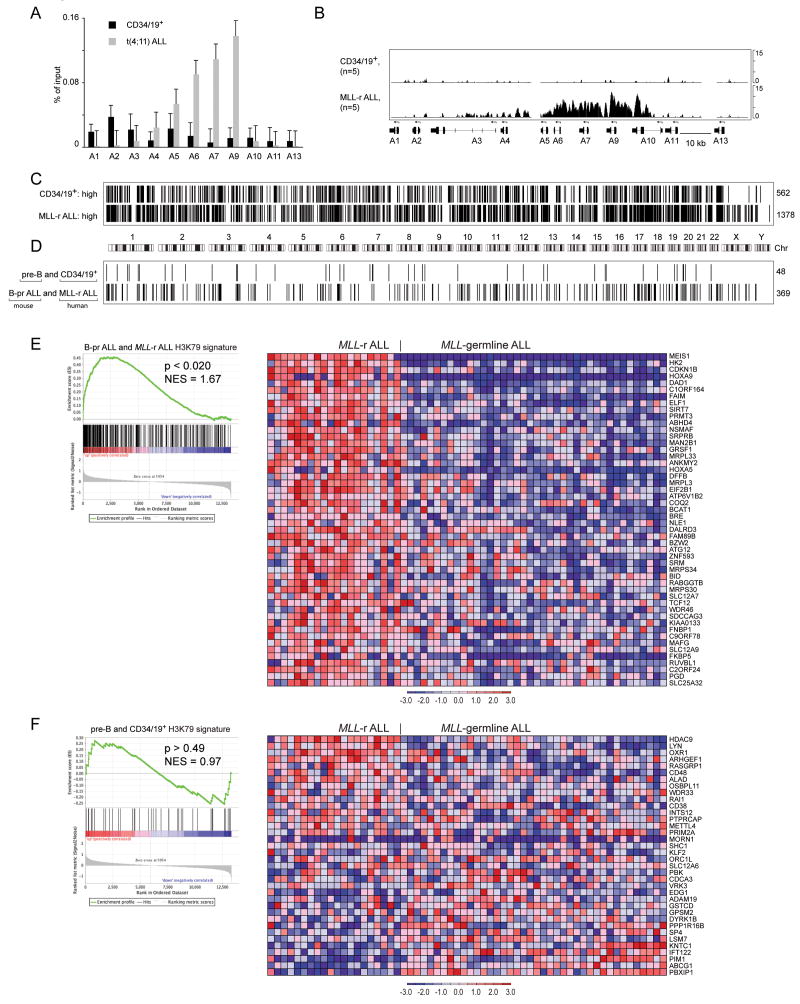
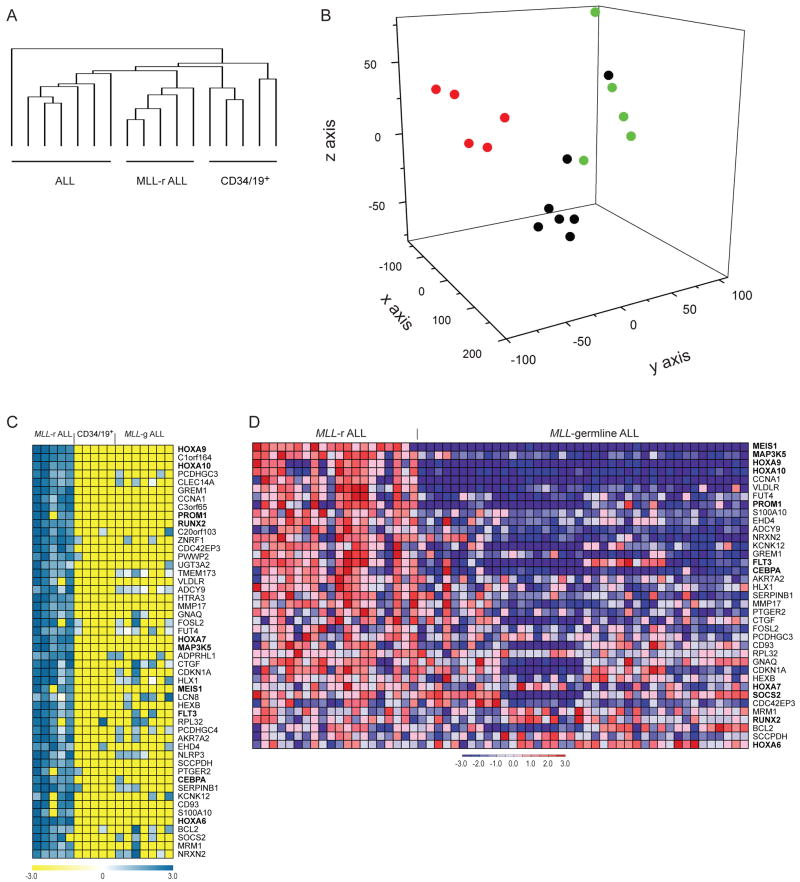
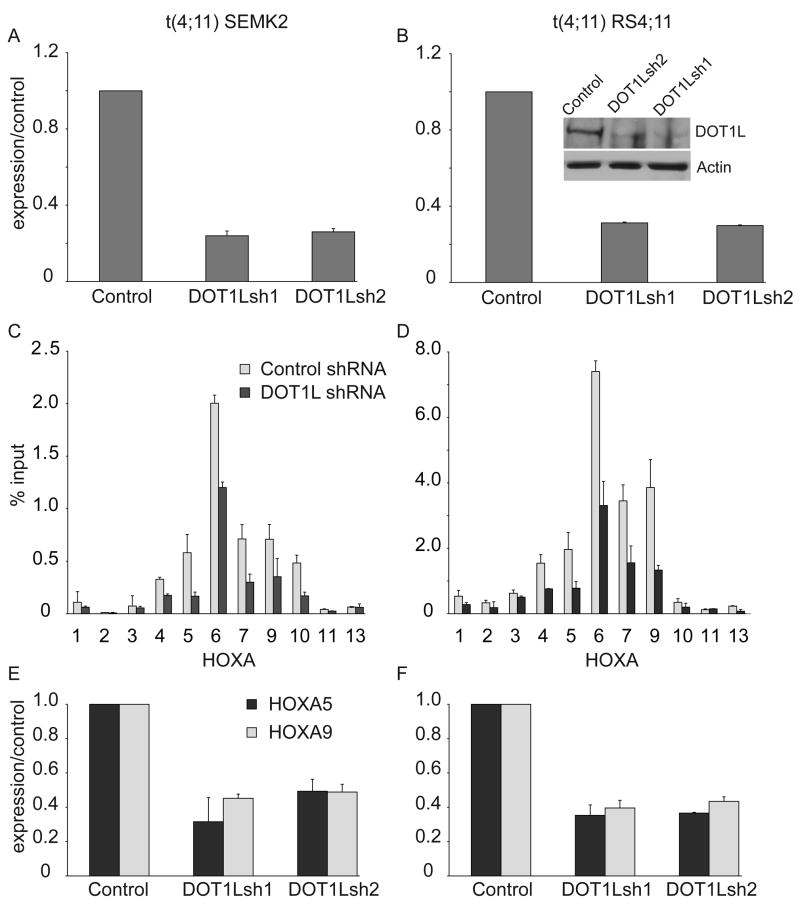
We created a mouse model wherein conditional expression of an Mll-AF4 fusion oncogene induces B precursor acute lymphoblastic (ALL) or acute myeloid leukemias (AML). Gene expression profile analysis of the ALL cells demonstrated significant overlap with human MLL-rearranged ALL. ChIP-chip analysis demonstrated histone H3 lysine 79 (H3K79) methylation profiles that correlated with Mll-AF4-associated gene expression profiles in murine ALLs and in human MLL-rearranged leukemias. Human MLL-rearranged ALLs could be distinguished from other ALLs by their H3K79 profiles, and suppression of the H3K79 methyltransferase DOT1L inhibited expression of critical MLL-AF4 target genes. We thus demonstrate that ectopic H3K79 methylation is a distinguishing feature of murine and human MLL-AF4 ALLs and is important for maintenance of MLL-AF4-driven gene expression.


Figures

Figure 1
Figure 1. Generation of mice with a conditional Mll-AF4stop allele
A Schematic representation of the MLL-AF4 fusion protein including a number of protein motifs. AT-hooks (AT-h 1–3); speckled nuclear localization sites (SNL1 and SNL2); transcriptional repression domain consisting of two functional subunits, (RD1) and (RD2); homologous regions among within the AF4/FMR2 family members (ALF); Serine-rich regions that contain a transactivation domain (Ser); nuclear localization signal (NL); C-terminal homology domain conserved between FMR2, AF4 and LAF4 family of transcription factors (CHD). B. A diagrammatic description of the Mll-AF4stop knockin allele. Mll exons are numbered 4 to 9. The poly-adenylation site (pA) and puromycin (puro) resistance cassette is shown. EcoRI (RI) and BamHI (BI) sites and Mll forward (F) and AF4 reverse (R) primers used for Mll-AF4 fusion RNA detection are shown. C. Southern blot analysis of EcoRI-digested genomic DNA from wild-type and targeted ESC, probed with the 5′-probe shown in B. D. RT-PCR analysis of Mll-AF4 transcript expression in total bone marrow from Mll-AF4stop mice retrovirally transduced either with “Hit and run Cre” (HR-Cre) or MSCV-MIG (control). (M) molecular weight marker in basepairs (bp).
Figure 2
Figure 2. Characterization of Mll-AF4 mediated B-precursor ALLs
A. Histopathologic analysis of B-pr ALL in Mll-AF4 mice. Cells consistent with lymphoblasts are found in the peripheral blood (left). The bone marrow (center) and spleen (right) are infiltrated with leukemia cells (right). B. FACS analysis of normal bone marrow (left) and leukemic bone marrow (right) using antibodies to B220, Gr1, Mac1, and CD19. C. Detailed immunophenotypic analysis of normal bone marrow (top) and leukemic bone marrow (middle) from a mouse with primary (1°) ALL and an ALL in a secondary (2°) recipient mouse (bottom). D. PCR based analysis showing germline or rearranged Immunoglobulin DH-JH heavy-chain loci in AML cells (11), ALL cells (15, 17, and 270), NIH3T3 cells or normal splenocytes. The arrow indicates germline (gl) DH-JH configuration. (M) molecular weight marker in basepairs (bp).
Figure 3
Figure 3. Gene expression in normal and malignant mouse B-cells and comparison to human leukemias
A Hierarchical clustering using 10218 filtered (min fold 3; min delta 100, background 20; ceiling 20000) probe sets. B. Expression of homeobox A, B, C, and D cluster genes in normal developing B-lymphocytes and B-pr ALL cells. C. GSEA analysis of gene expression in human MLL-rearranged ALL (n=20) as compared to MLL-germline ALL (n=40) (Ross et al., 2003) using the top 386 genes identified as highly expressed in murine Mll-AF4 ALL as a gene set. GSEA enrichment plot (left) and the top 50 genes that show increased expression in human MLL-rearranged leukemias are shown (right).
Figure 4
Figure 4. ChIP analysis of histone methylation in mouse Mll-AF4 B-precursor ALL and normal pre-B cells
A Fold increase in trimethyl-H3K4, trimethyl-H3K27, trimethyl-H3K36, and dimethyl H3K79 marks associated with Hoxa9 promoter in B-pr ALL over pre-B cells as assayed by ChIP-qPCR. Two tailed T-test: H3K4 p=0.05; H3K79 p=0.005. Error bars represent +/− standard deviation (SD) between 4 independent experiments. B. Correlation of HoxA9 expression with H3K79me2 content on the HoxA9 promoter. HoxA9/Gapdh ratio (HoxA9 expression) was assessed by RT-qPCR and H3K79me2 content (percent of input) on HoxA9 promoter was assessed by ChIP-qPCR in pre-B (filled circles, n=2) and B-pr (open circles, n=9) ALL samples. Pearson correlation R=0.911, two tailed t-test p<0.0001. C. Enrichment of H3K79me2 associated with HoxA cluster promoter regions in B-pr ALL and normal pre-B cells expressed as a percentage of input. Error bars represent +/− SD of triplicates in one of 3 independent experiments. D. Identically scaled average tracks from ChIP-chip analysis representing HoxA cluster loci in normal pre-B (n=3) and B-pr ALL (n=3) cells. E. Graphical (bar) representation of regions associated with H3K79 me2 in normal pre-B and B-pr ALL cells. Averaged MAT scores from genome-wide promoter analysis of 3 pre-B cell and 3 B-pr ALL samples were used to define genomic regions possessing significant H3K79 signal (p<10−5) over background. The bars represent 285 genes that were identified to be associated with H3K79me2 in pre-B cells but not in B-pr ALL as compared with 1186 genes associated with H3K79me2 in B-pr ALL but not pre-B cells. F. Correlation of H3K79me2 marks with gene expression in B-pr ALL. GSEA was performed using the top (by MAT score) 300 genes (of 1186 genes) in the B-pr ALL H3K79 signature as a gene set and assessed for enrichment in those genes more highly expressed in B-pr ALL as compared to normal mouse pre-B cells. GSEA enrichment plot (left) and expression of genes (right) corresponding to the top 50 differentially expressed genes from the B-pr ALL H3K79 signature NES 1.88; p<0.005. G. Correlation of H3K79me2 marks with gene expression in pre-B cells. GSEA was performed using 285 genes of pre-B H3K79 signature as a gene set. GSEA enrichment plot (left) and expression of genes (right) corresponding to the top 50 differentially expressed genes from the B-pr ALL H3K79 signature NES=1.91; p<0.005.
Figure 5
Figure 5. ChIP-chip analysis of histone methylation in human MLL-rearranged ALL and normal pre-B cells
A Enrichment of H3K79-dimethyl marks associated with HOXA cluster promoters in t(4;11) ALL and human bone marrow Lin CD34+ CD19+ (CD34/19+) cells expressed as percentage of input as assessed by ChIP-qPCR. Error bars represent +/− SD of triplicates in one of 3 independent experiments. B. Identically scaled average tracks from ChIP-chip analysis of H3K79me2 modifications associated with HOXA cluster loci in human CD34/19+ cells (n=5) or MLL-rearranged ALL (MLL-r ALL) (n=5). C. Graphical (bar) representation of regions associated with H3K79me2 in normal CD34/CD19+ and MLL-rearranged ALL cells. 562 genes were identified in CD34/19+ cells but not in MLL-rearranged ALL (CD34/19+: high) whereas 1378 genes with significant H3K79 signal were present in MLL-rearranged ALL but not CD34/19+ cells (MLL-r ALL: high). D. 48 genes had higher H3K79 ChIP-chip signals in both mouse pre-B and human CD34/19+ cells as compared to mouse and human leukemias. 369 genes had higher H3K79 ChIP-chip signal in both mouse Mll-AF4 and human MLL-rearranged ALL as compared to normal B-cells. Fisher test p<0.0001. E. GSEA analysis of the 369-gene signature with elevated H3K79me2 found in both human MLL-rearranged ALL and mouse B-pr ALL found enrichment of the gene expression signature in MLL-rearranged ALL as compared to MLL-germline ALL (NES=1.63, p<0.019). GSEA enrichment plot (left) and heatmap (right) of expressio n for the top 50 probe sets in MLL-rearranged ALL as compared to MLL-germline ALL (Ross et al., 2003). F. GSEA analysis of the 48 genes with elevated H3K79me2 found in both human bone marrow CD34/CD19+ and mouse pre-B cells found no enrichment of the signature in MLL-rearranged ALL as compared to MLL-germline ALL (NES=0.97, p>0.49). GSEA enrichment plot (left) and heatmap (right) of expression for 36 probe sets in MLL-rearranged ALL as compared to MLL-germline ALL (Ross et al., 2003).
Figure 6
Figure 6. Unsupervised and supervised analysis of ChIP-chip data for H3K79 methylation in MLL-rearranged ALL, MLL-germline ALL, and CD34/19+ cells
A. Hierarchical clustering of 5438 genes associated with H3K79me2 demonstrates that MLL-rearranged ALL samples cluster together and are separate from other MLL-germline ALLs and normal B-pr cells. B. Principal component analysis (PCA) of the same 5438 genes associated with H3K79me2 separates MLL-rearranged ALL (red) from MLL-germline ALL (black) and CD34/19+ (green). C. The top 50 genes associated with H3K79me2 in MLL-rearranged ALL compared to the rest of the samples are shown. Genes were ranked based on difference of means of MAT scores between MLL-rearranged (MLL-r) ALL samples and MLL-germline (MLL-g) ALL plus CD34/19+ cells. D. Expression of genes identified in figure 6C. 37 of the 50 genes in 6D had corresponding probesets on the U133A arrays.
Figure 7
Figure 7. shRNA mediated DOT1L suppression in human MLL-AF4 cell lines
SEMK2 (A) or RS4;11 (B) ALL cell lines possessing a t(4;11) were transduced with either a control shRNA or one of 2 different shRNAs that target DOT1L, and DOT1L RNA expression was assessed by quantitative RT−PCR and western blot for RS4;11 cells 72 hours after transduction (Inset). Error bars represent +/− SD of duplicates in one of two independent experiments. C, D. Chromatin Immunoprecipitation assessment of H3K79 associated with HOXA cluster genes 96 hours after treatment of SEMK2 (C) cells or RS4;11 Cells (D) with either a control or DOT1L-directed shRNA (DOT1Lsh1) shRNA. Error bars represent +/− SD of duplicates in one of two independent experiments. E, F. Assessment of HOXA5 and HOXA9 expression in SEMK2 (E) or RS4;11 (F) cells 96 hours after lentiviral transduction with either control or one of two different shRNA constructs. Error bars represent +/− SD of duplicates in one of two independent experiments.

Comment in

References

    1. Armstrong SA, Kung AL, Mabon ME, Silverman LB, Stam RW, Den Boer ML, Pieters R, Kersey JH, Sallan SE, Fletcher JA, et al. Inhibition of FLT3 in MLL. Validation of a therapeutic target identified by gene expression based classification. Cancer Cell. 2003;3:173–183. - PubMed
    1. Armstrong SA, Staunton JE, Silverman LB, Pieters R, den Boer ML, Minden MD, Sallan SE, Lander ES, Golub TR, Korsmeyer SJ. MLL translocations specify a distinct gene expression profile that distinguishes a unique leukemia. Nat Genet. 2002;30:41–47. - PubMed
    1. Ayton PM, Cleary ML. Molecular mechanisms of leukemogenesis mediated by MLL fusion proteins. Oncogene. 2001;20:5695–5707. - PubMed
    1. Biondi A, Cimino G, Pieters R, Pui CH. Biological and therapeutic aspects of infant leukemia. Blood. 2000;96:24–33. - PubMed
    1. Bitoun E, Oliver PL, Davies KE. The mixed-lineage leukemia fusion partner AF4 stimulates RNA polymerase II transcriptional elongation and mediates coordinated chromatin remodeling. Hum Mol Genet. 2007;16:92–106. - PubMed

Publication types

MeSH terms

Associated data