. 2009 Jan 23;385(3):867-88.
doi: 10.1016/j.jmb.2008.10.037. Epub 2008 Oct 19.

Kinetic and X-ray structural evidence for negative cooperativity in substrate binding to nicotinate mononucleotide adenylyltransferase (NMAT) from Bacillus anthracis

Affiliations

Kinetic and X-ray structural evidence for negative cooperativity in substrate binding to nicotinate mononucleotide adenylyltransferase (NMAT) from Bacillus anthracis

Valerie C Sershon et al. J Mol Biol. .

Abstract

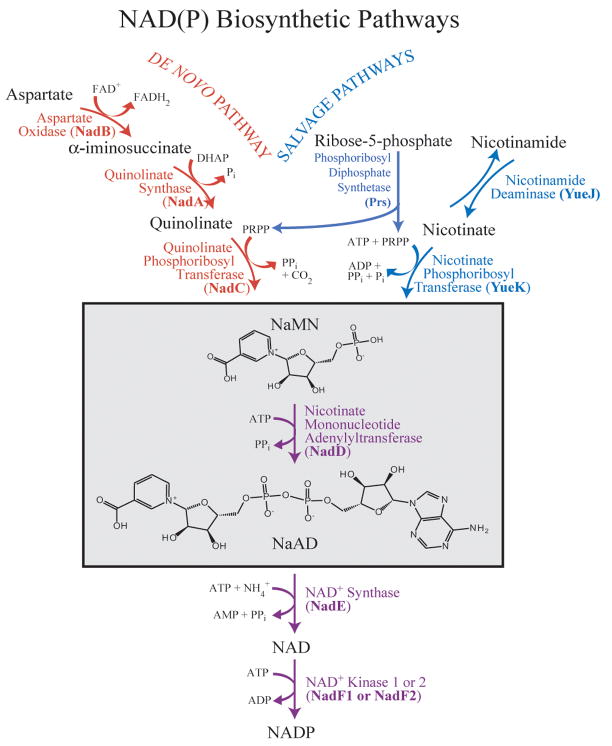
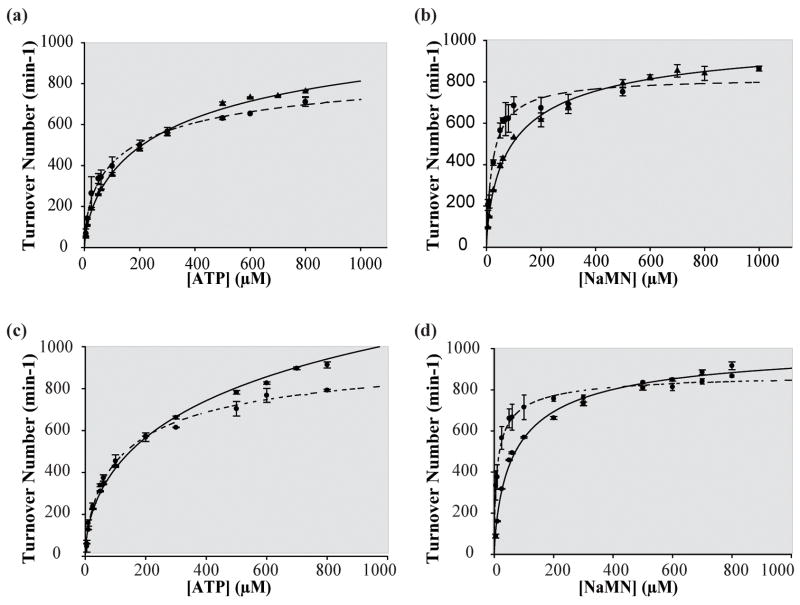
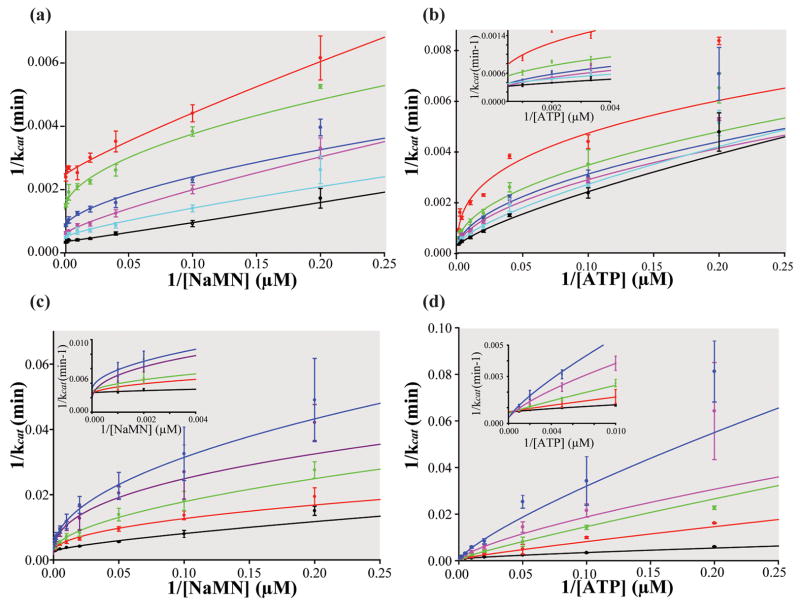
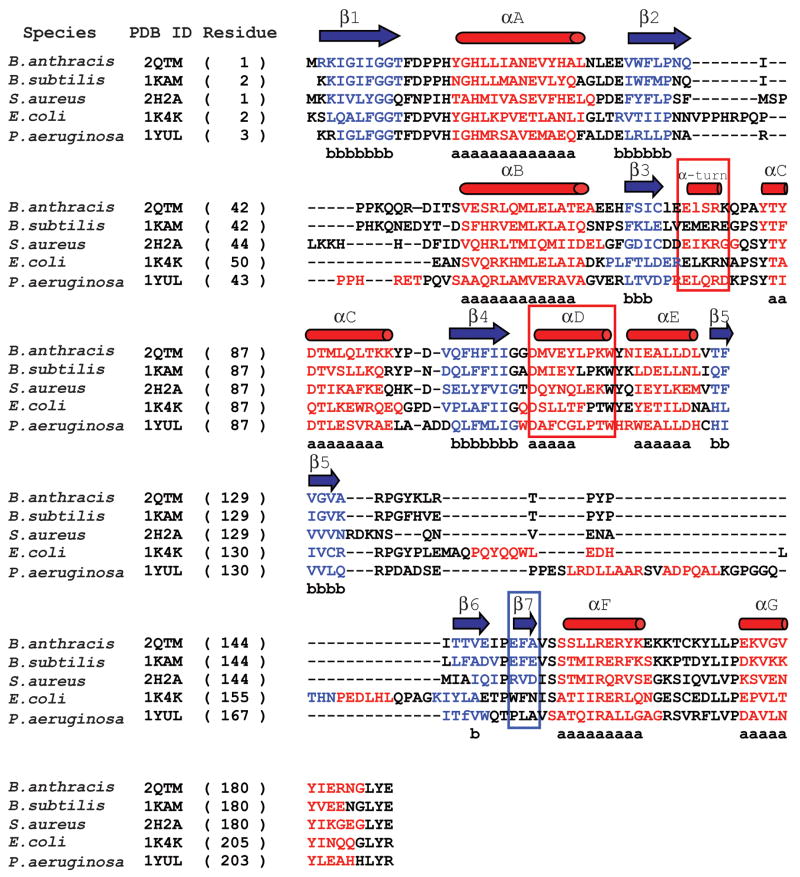
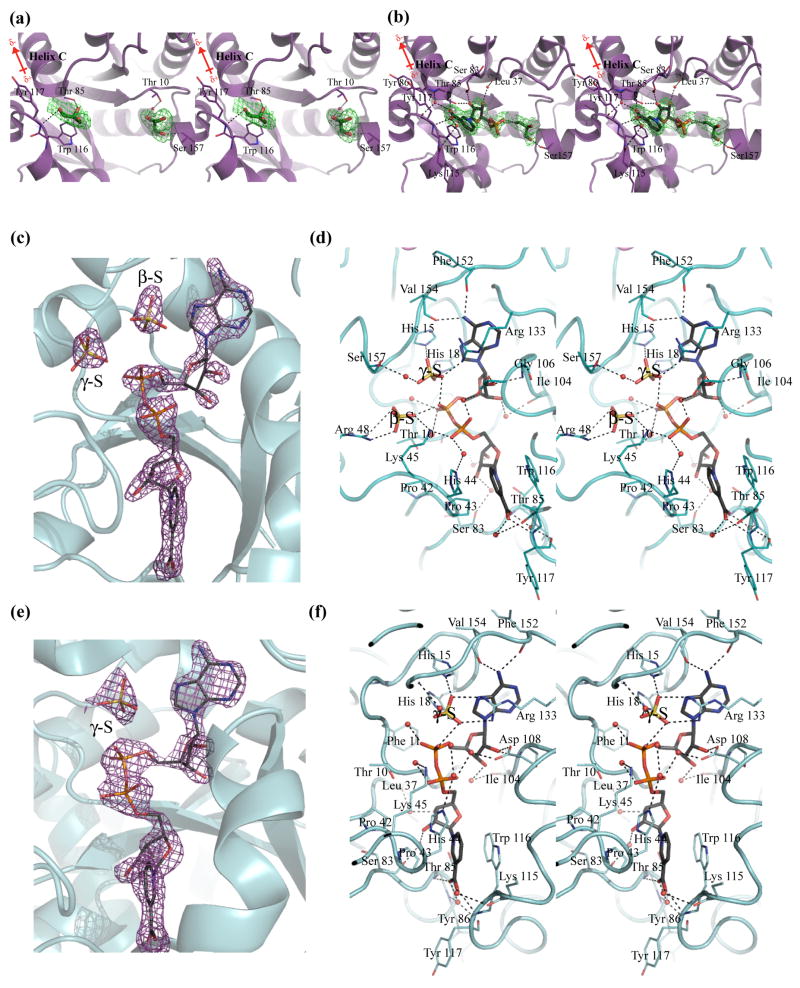
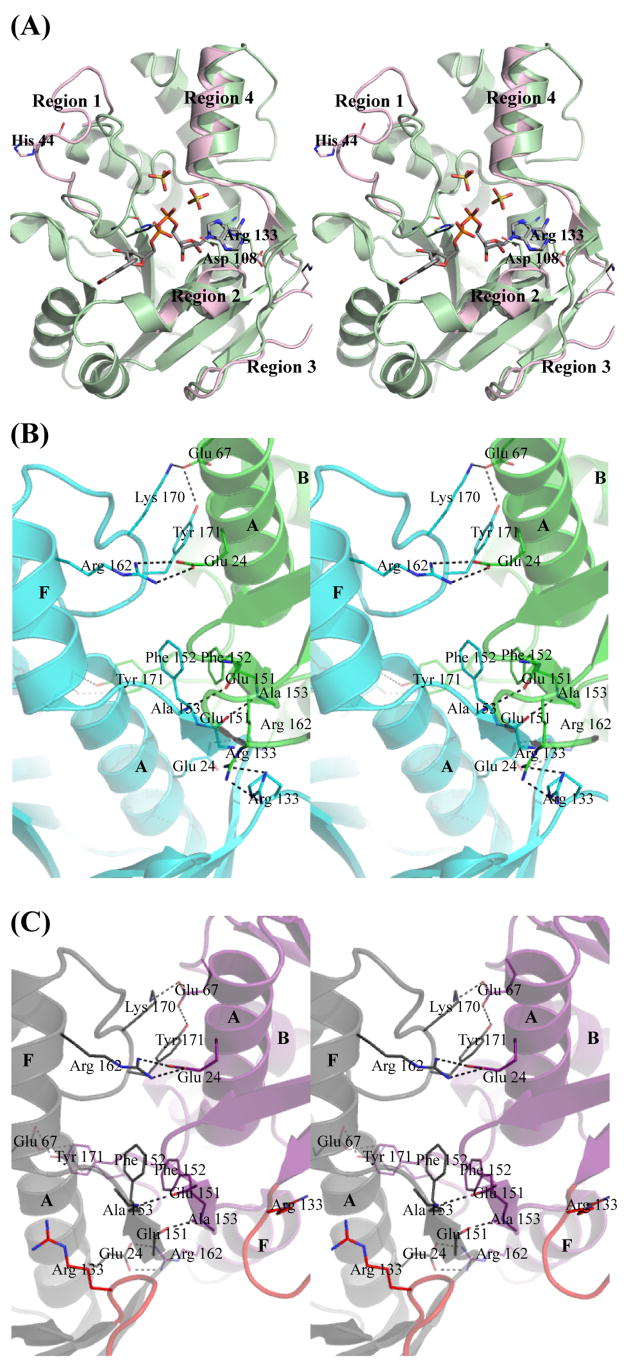
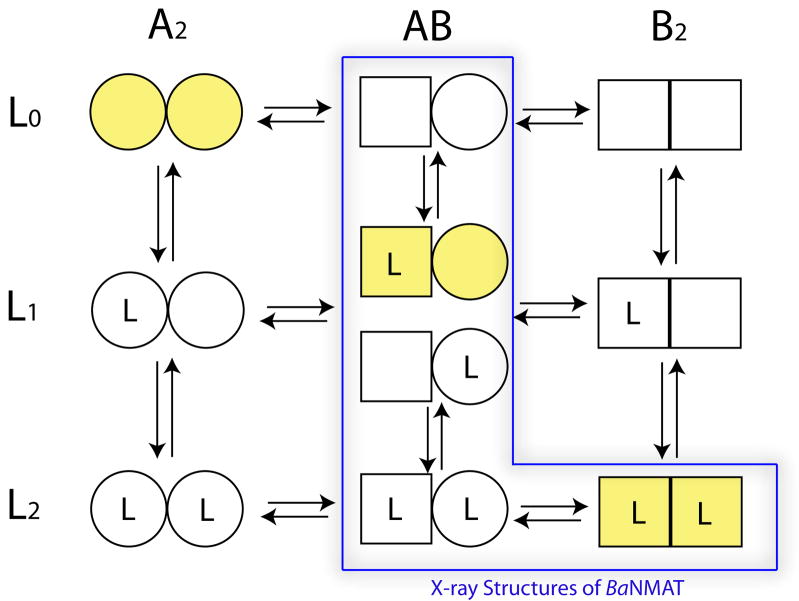
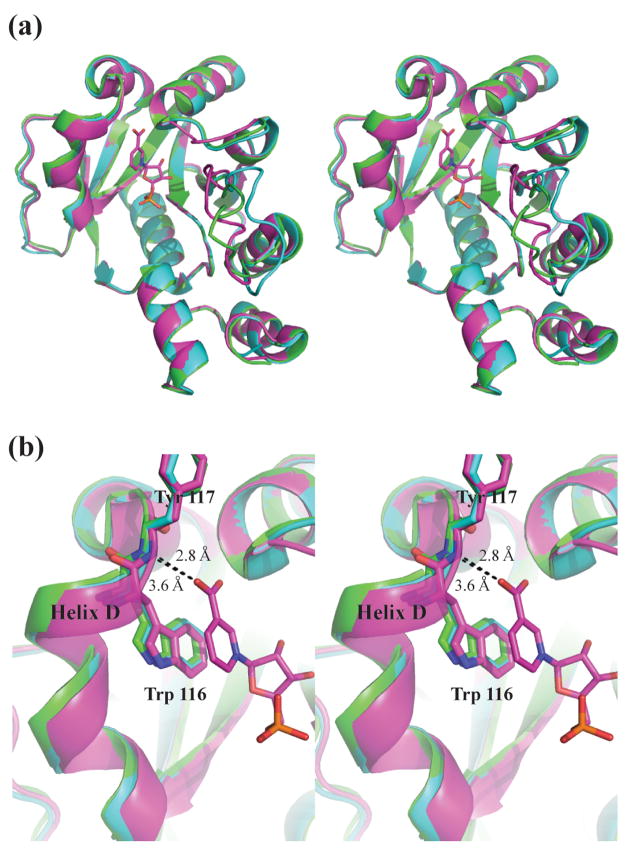
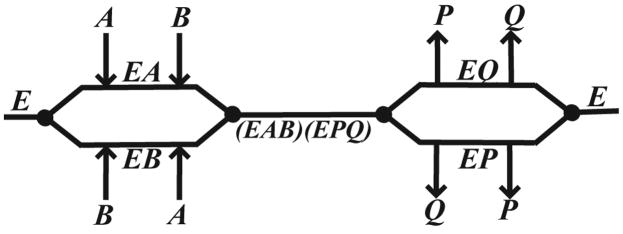
Biosynthesis of NAD(P) in bacteria occurs either de novo or through one of the salvage pathways that converge at the point where the reaction of nicotinate mononucleotide (NaMN) with ATP is coupled to the formation of nicotinate adenine dinucleotide (NaAD) and inorganic pyrophosphate. This reaction is catalyzed by nicotinate mononucleotide adenylyltransferase (NMAT), which is essential for bacterial growth, making it an attractive drug target for the development of new antibiotics. Steady-state kinetic and direct binding studies on NMAT from Bacillus anthracis suggest a random sequential Bi-Bi kinetic mechanism. Interestingly, the interactions of NaMN and ATP with NMAT were observed to exhibit negative cooperativity, i.e. Hill coefficients <1.0. Negative cooperativity in binding is supported by the results of X-ray crystallographic studies. X-ray structures of the B. anthracis NMAT apoenzyme, and the NaMN- and NaAD-bound complexes were determined to resolutions of 2.50 A, 2.60 A and 1.75 A, respectively. The X-ray structure of the NMAT-NaMN complex revealed only one NaMN molecule bound in the biological dimer, supporting negative cooperativity in substrate binding. The kinetic, direct-binding, and X-ray structural studies support a model in which the binding affinity of substrates to the first monomer of NMAT is stronger than that to the second, and analysis of the three X-ray structures reveals significant conformational changes of NMAT along the enzymatic reaction coordinate. The negative cooperativity observed in B. anthracis NMAT substrate binding is a unique property that has not been observed in other prokaryotic NMAT enzymes. We propose that regulation of the NAD(P) biosynthetic pathway may occur, in part, at the reaction catalyzed by NMAT.


Figures

Figure 1
Figure 1. Bacterial NAD(P) biosynthetic pathway
The de novo pathway (shown in red) begins with aspartate, while the salvage pathway (shown in blue) uses either nicotinamide or nicotinate mononucleotide as its starting substrate. The reaction catalyzed by NMAT sits at the branch point between the two pathways (outlined with a box). Gene names are shown in parentheses. Abbreviations used: DHAP, dihydroxyacetone phosphate; PRPP, 5-phospho-ribose-1-pyrophosphate; NaMN, nicotinate mononucleotide; NaAD, nicotinate adenine dinucleotide; NAD, nicotinamide adenine dinucleotide; NADP, nicotinamide adenine dinucleotide phosphate.
Figure 2
Figure 2. Comparison of continuous and discontinuous activity assays for (His)6-tag and native B. anthracis NMAT
(a) The (His)6-tag B. anthracis NMAT ATP kinetics performed at 11 different [ATP] ranging from 5–800 μM and fixed [NaMN] at 600 μM using both the discontinuous (solid line) and continuous (dashed line) activity assays. (b) The (His)6-tag B. anthracis NMAT NaMN kinetics performed at 11 different [NaMN] ranging from 5–800 μM and fixed [ATP] at 600 μM using both the discontinuous (solid line) and continuous (dashed line) activity assays. (c) The native B. anthracis NMAT ATP kinetics performed at 11 different [ATP] ranging from 5–800 μM and fixed [NaMN] at 600 μM using both the discontinuous (solid line) and continuous (dashed line) activity assays. (d) The native B. anthracis NMAT NaMN kinetics performed at 11 different [NaMN] ranging from 5–800 μM and fixed [ATP] at 600 μM using both the discontinuous (solid line) and continuous (dashed line) activity assays.
Figure 3
Figure 3. Kinetic mechanism of B. anthracis NMAT
Insets show the y-intercepts. (a) Lineweaver-Burk plot of initial rates of product formation at variable [NaMN]’s and six fixed [ATP]. Red: 10 μM ATP, Green: 25 μM ATP, Blue: 50 μM ATP, Purple: 100 μM ATP, Cyan: 300 μM ATP, and Black: 1 mM ATP. (b) Lineweaver-Burk plot of initial rates of product formation at variable [ATP] and six fixed [NaMN]. Red: 10 μM NaMN, Green: 25 μM NaMN, Blue: 50 μM NaMN, Purple: 100 μM NaMN, Cyan: 300 μM NaMN, and Black: 1 mM NaMN (c) Lineweaver-Burk plot of product inhibition with five, fixed [NaAD] (Black: no NaAD, Red: 5 μM NaAD, Green: 25 μM NaAD, Purple: 50 μM NaAD, and Blue: 100 μM NaAD), variable [NaMN], and fixed [ATP] at 50 μM. (d) Lineweaver-Burk plot of product inhibition with five, fixed [NaAD] (Black: no NaAD, Red: 5 μM NaAD, Green: 25 μM NaAD, Purple: 50 μM NaAD, and Blue: 100 μM NaAD), variable [ATP], and fixed [NaMN] at 40 μM. Negative cooperativity is seen by the downward curvature in the Lineweaver-Burk plots.
Figure 4
Figure 4. ITC Analysis of B. anthracis NMAT
(a) Titrations of 167 μM NMAT with 20 mM NaMN shown in the top panel, with data fit to the sequential binding site model in the bottom panel (solid squares)(solid circles show the control of 20 mM NaMN into buffer). (b) Titrations of 167 μM NMAT with 20 mM ATP and 25 mM MgCl2 shown in the top panel, with data fit to the sequential binding site model in the bottom panel (solid squares)(solid circles show the control of 20 mM ATP and 25 mM MgCl2 into buffer). (c) Titrations of 167 μM NMAT 4 mM NaAD shown in the top panel, with data fit to the single site binding model in the bottom panel. The heat of dilution was determined by averaging the last 8 injections.
Figure 5
Figure 5. Overall architecture of B. anthracis NMAT and overlay with B. subtilis NMAT
(a) Ribbon diagram of the functional dimer of NMAT. The Rossman folds of chain A and B are shown in cyan and green, respectively. The C-terminal helical domains of chains A and B are colored yellow and orange, respectively. (b) Overlay of B. anthracis NMAT (shown in cyan) and B. subtilis NMAT (shown in purple) showing the replacement of the small helical turn in B. subtilis NMAT with helix D of B. anthracis NMAT shown in red. The small helical turn in B. anthracis NMAT is shown in dark blue.
Figure 6
Figure 6. Structure-based sequence alignment of bacterial NMAT’s
A structure-based sequence alignment of the B. anthracis NMAT with B. subtilis NMAT, S. aureus NMAT, E. coli NMAT, and P. aeruginosa NMAT. B. anthracis NMAT secondary structure is shown above the alignment, where blue arrows and red cylinders denote β-sheets and α-helices, respectively. Residues involved in β-sheet and α-helix formation are colored blue and red, respectively. Black colored residues represent loop regions. Lower case “b’s” represent conserved β-sheet formation and lower case “a’s” represent conserved α-helix formation. The red boxes represent the secondary structural elements that are different between B. anthracis and B. subtilis NMAT structures. The blue box indicates the different secondary structural elements between gram (−) and gram (+) bacteria. This figure was generated using STRAP (http://www.charite.de/bioinf/strap/) and the secondary structure of B. anthracis NMAT was manually added. STRAP inserted many unnecessary gaps and therefore for clarity the gaps were removed in the region of the α-helix D.
Figure 7
Figure 7. Active sites of B. anthracis NMAT in complex with NaMN and NaAD
(a) NaMN-binding site of chain A. (b) NaMN-binding site of chain B. The final Fo-Fc omit maps are shown contoured at 3.0σ in green with NaMN and glycerol molecules omitted from the calculations. The bound glycerol molecules are shown as sticks in green and the bound NaMN molecule is shown in dark gray. Water molecules are shown as red spheres, and hydrogen bonds are indicated by broken lines. (c) An Fo-Fc omit map showing the electron density for NaAD, the γ-S, and β-S sulfates in chain B. (d) The NaAD and sulfate ions interactions with NMAT observed in chain B. (e) An Fo-Fc omit map showing the electron density for NaAD and the γ-S sulfate in chain C (identical interactions with NaAD are seen in chain A). Chains B and C make up the functional dimer. (f) The NaAD and the single sulfate ion interactions with NMAT observed in chain C. The final Fo-Fc omit maps are shown contoured at 3.0σ and in purple with NaAD and sulfates omitted from calculations. The bound NaAD molecules are shown in dark gray. Sulfate ions are shown in yellow and water molecules are shown as red spheres. Hydrogen bonds are indicated by broken lines
Figure 8
Figure 8. Conformational changes and dimerization interface of B. anthracis NMAT
(a) Major conformational changes are labeled as regions 1–4. The NaAD-complex structure is shown in green. Only the regions of conformational change seen in the apoenzyme are shown in pink. (b) Dimerization interface of the apo and NaMN-bound NMAT. Chain A is shown in blue and chain B is shown in green. (c) Dimerization interface of the NaAD-bound NMAT. Chain B is shown in gray and chain C is shown in purple. The loop between β-strands 5 and 6 is shown in red in both chains. α-helices are labeled in letters.
Figure 9
Figure 9. General sequential model for molecular species in a protein composed of two subunits which undergoes a conformational change under the influence of bound ligand
The model is adapted from Fig. 5 of Koshland and Neet (1968) and predicts both positive and negative cooperativity. It is assumed that each subunit can exist in two conformations and ligand (L) can bind to either subunit. Ligand L could be substrate, product, or other type of effector molecule. All species shown are potentially possible in the solution or crystalline state. Relative amounts of species will depend on the equilibrium constant of the conversion from A to B (K), the equilibrium constant for binding of L to conformation A (KL′) or B(KL), and strength of subunit interactions (KAA, KAB, KAB),. The simplest sequential model would assume exclusive binding to one conformation and no change in conformation in the absence of bound ligand, i.e. yellow-shaded molecular species. Cooperativity in the sequential model requires preferential binding to one conformation, e.g., B, a shift from A to B conformations with added ligand, and a change in subunit interactions, KAA different from KAB, KAB or both. The values for these equilibrium constants for solution may be different than those for the crystalline form of the protein. The negative cooperativity observed in the kinetic response of B. anthracis NMAT to the binding of substrates suggests it is capable of forming any of the species. The X-ray crystal structures of NMAT represent the AB (apoenzyme), L1AB (NaMN bound) and L2AB, L2B2 (NaAD bound) species of the enzyme. The product-bound, NaAD-NMAT complex, L2AB, is represented by the dimer within the trimeric, asymmetric unit of the unit cell, and the remaining monomer, which composes a symmetrical dimer generated by a 2-fold, crystallographic axis, represents the L2B2 species. The observed conformational species for NMAT in these studies are indicated by the blue box.
Figure 10
Figure 10. Overlay of Apoenzyme and NaMN-complex of B. anthracis NMAT
Apoenzyme chain A is shown in green. Chain A and chain B of the NaMN-complex structure is shown in cyan and purple, respectively. (a) Overview of NMAT, showing Chain A of the apoenzyme and chain A of the NaMN-complex structure are in the same conformation, while chain B of the NaMN-complex structure is in a different conformation. (b) Close-up showing the shift in helix D which causes the hydrogen bond formed from the backbone amide of Try117 and the carboxylate of NaMN to either be formed as in chain B of the NaMN-complex or not formed as in chain A of the apoenzyme or the NaMN-complex.
Scheme 1
Scheme 1. Cleland Diagram
Random bi-bi sequential kinetic mechanism. Abbreviations: E, NMAT; A and B, either NaMN or ATP; P and Q either PPi or NaAD.

Similar articles

Cited by

References

    1. Kalamas AG. Anthrax. Anethesiology Clinics of North America. 2004:22. - PubMed
    1. Atlas RM. Bioterriorism: From threat to reality. Annu Rev Microbiol. 2002;56:167–185. - PubMed
    1. Price LB, Vogler A, Pearson T, Busch JD, Schupp JM, Kleim P. In vitro selection and characterization of Bacillus anthracis mutants with high-level resistance to ciprofloxacin. Antimicrob Agents chemother. 2003;47:2362–2365. - PMC - PubMed
    1. Grohs P, Podglajen I, Gutmann L. Activities of different fluoroquinolones against Bacillus anthracis mutants selected in vitro and harboring topoisomerase mutations. Antimicrob Agents chemother. 2004;48:3024–3027. - PMC - PubMed
    1. Athamna A, Athamna M, Abu-Rashed N, Medlej B, Bast DJ, Rubinstein E. Selection of Bacillus anthracis isolates resistant to antibiotics. J Antimicrob Chemother. 2004;54:424–428. - PubMed

Publication types

MeSH terms

Substances

LinkOut - more resources