. 2008 Nov 11;105(45):17268-72.
doi: 10.1073/pnas.0806977105. Epub 2008 Oct 31.

Universality of citation distributions: toward an objective measure of scientific impact

Affiliations

Universality of citation distributions: toward an objective measure of scientific impact

Filippo Radicchi et al. Proc Natl Acad Sci U S A. .

Abstract

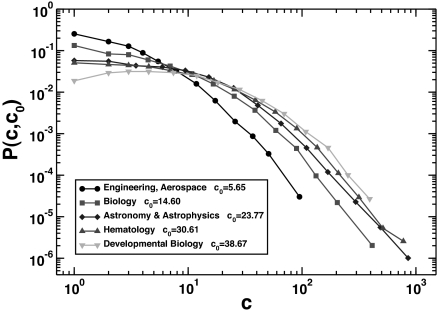
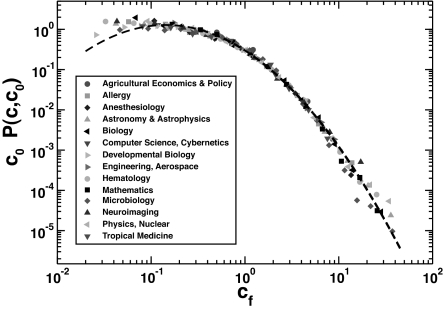
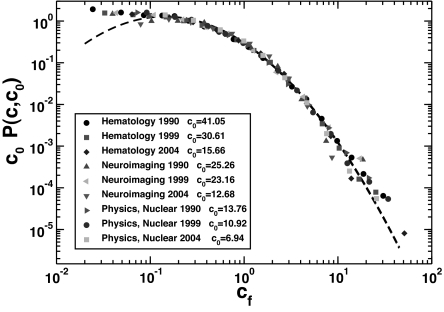
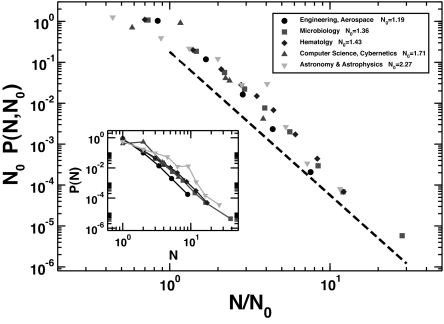
We study the distributions of citations received by a single publication within several disciplines, spanning broad areas of science. We show that the probability that an article is cited c times has large variations between different disciplines, but all distributions are rescaled on a universal curve when the relative indicator c(f) = c/c(0) is considered, where c(0) is the average number of citations per article for the discipline. In addition we show that the same universal behavior occurs when citation distributions of articles published in the same field, but in different years, are compared. These findings provide a strong validation of c(f) as an unbiased indicator for citation performance across disciplines and years. Based on this indicator, we introduce a generalization of the h index suitable for comparing scientists working in different fields.


Conflict of interest statement

The authors declare no conflict of interest.

Figures

Fig. 1.
Fig. 1.
Normalized histogram of the number of articles P(c,c0) published in 1999 and having received c citations. We plot P(c,c0) for several scientific disciplines with different average number c0 of citations per article.
Fig. 2.
Fig. 2.
Rescaled probability distribution c0 P(c,c0) of the relative indicator cf = c/c0, showing that the universal scaling holds for all scientific disciplines considered (see Table 1). The dashed line is a lognormal fit with σ2 = 1.3.
Fig. 3.
Fig. 3.
We rank all articles according to the bare number of citations c and the relative indicator cf. We then plot the percentage of articles of a particular discipline present in the top z% of the general ranking, for the rank based on the number of citations (A and C) and based on the relative indicator cf (B and D). Different values of z (different graphs) lead to a very similar pattern of results. The average values and the standard deviations of the bin heights shown are also reported in Table 2. The numbers identify the disciplines as they are indicated in Table 1.
Fig. 4.
Fig. 4.
Rescaled probability distribution c0 P(c,c0) of the relative indicator cf = c/c0 for 3 disciplines (Hematology, Neuroimaging, and Nuclear Physics) for articles published in different years (1990, 1999, and 2004). Despite the natural variation of c0 (c0 grows as a function of the elapsed time), the universal scaling observed over different disciplines naturally holds also for articles published in different time periods. The dashed line is a lognormal fit with σ2 = 1.3.
Fig. 5.
Fig. 5.
The same distributions as in Inset rescaled by the average number N0 of publications per author in 1999 in the different disciplines. The dashed line is a power law with exponent −3.5. (Inset) Distributions of the number of articles, N, published by an author during 1999 in several disciplines.

Similar articles

Cited by

References

    1. Hirsch JE. An index to quantify an individual's scientific research output. Proc Natl Acad Sci USA. 2005;102:16569–16572. - PMC - PubMed
    1. Egghe L. Theory and practise of the g-index. Scientometrics. 2006;69:131–152.
    1. Hirsch JE. Does the h index have predictive power? Proc Natl Acad Sci USA. 2007;104:19193–19198. - PMC - PubMed
    1. Evidence Ltd. The use of bibliometrics to measure research quality in UK higher education institutions. [Accessed Oct. 7, 2008];2007 Available at: http://bookshop.universitiesuk.ac.uk/downloads/bibliometrics.pdf. - PubMed
    1. Kinney AL. National scientific facilities and their science impact on nonbiomedical research. Proc Natl Acad Sci USA. 2007;104:17943–17947. - PMC - PubMed

LinkOut - more resources