. 2008 Nov 27;456(7221):470-6.
doi: 10.1038/nature07509.

Alternative isoform regulation in human tissue transcriptomes

Affiliations

Alternative isoform regulation in human tissue transcriptomes

Eric T Wang et al. Nature. .

Abstract

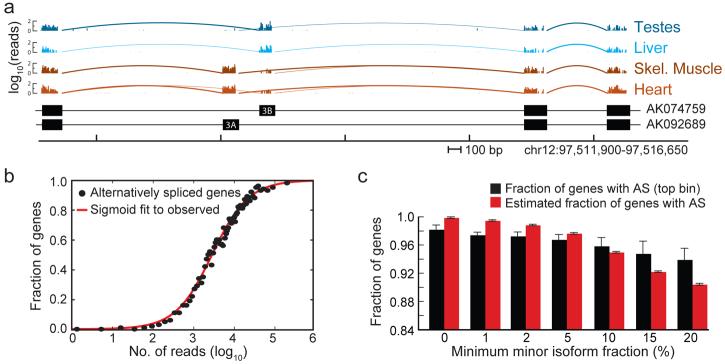
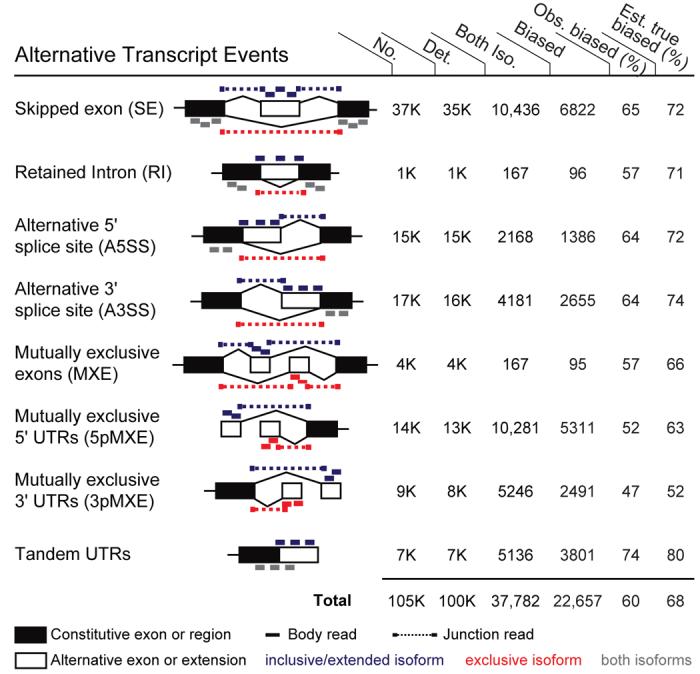
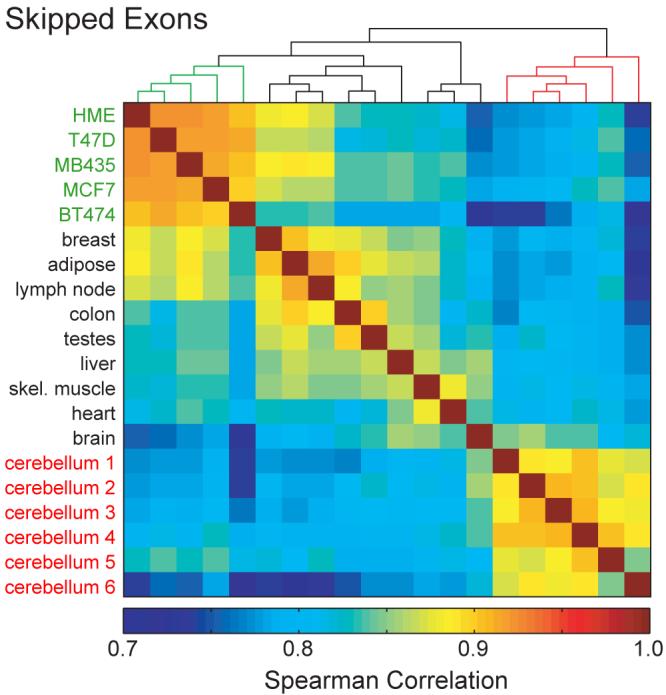
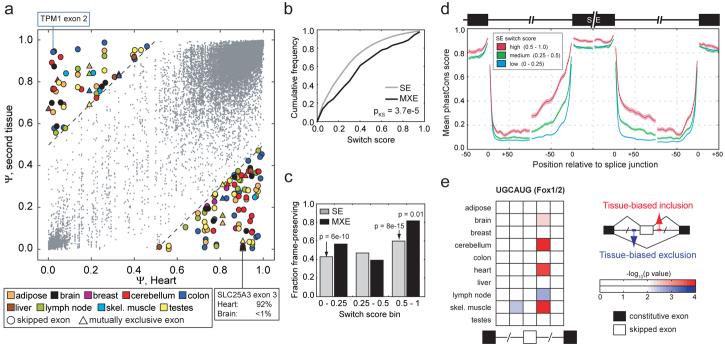
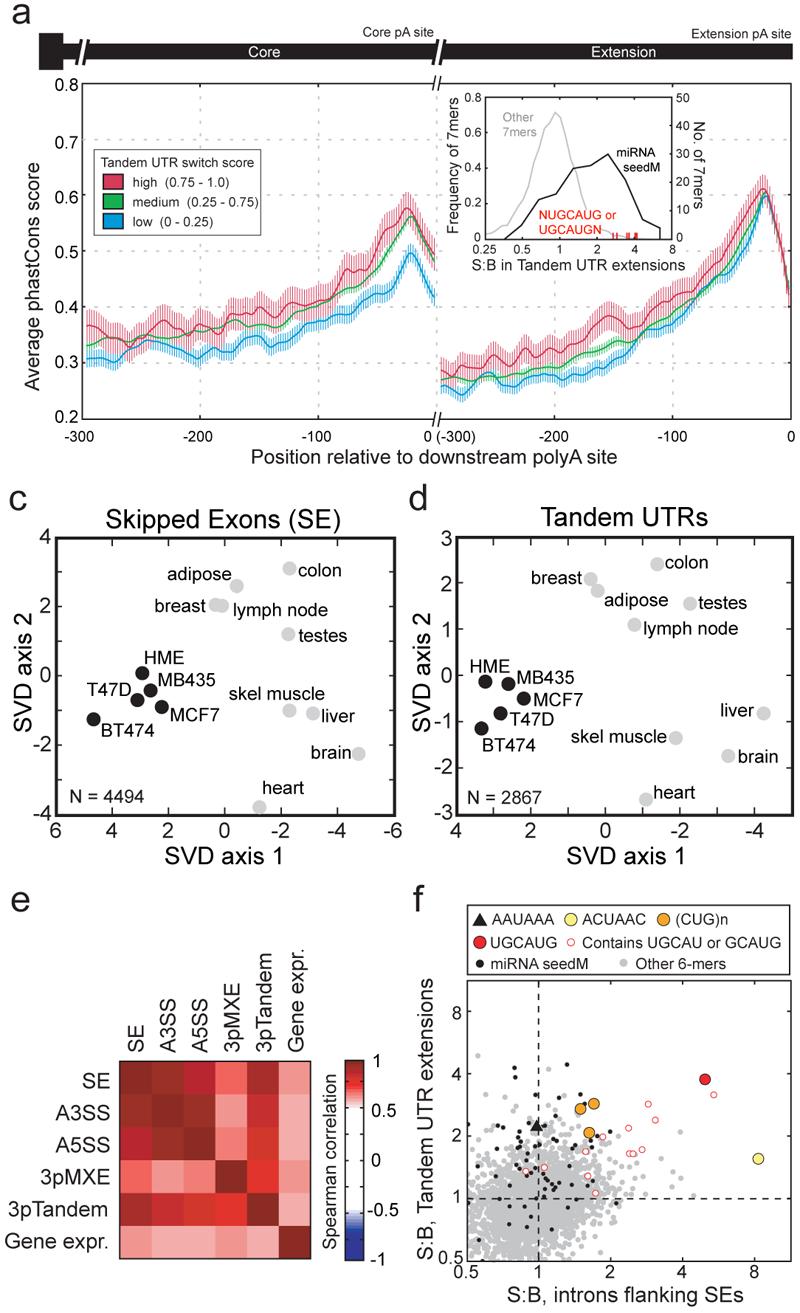
Through alternative processing of pre-messenger RNAs, individual mammalian genes often produce multiple mRNA and protein isoforms that may have related, distinct or even opposing functions. Here we report an in-depth analysis of 15 diverse human tissue and cell line transcriptomes on the basis of deep sequencing of complementary DNA fragments, yielding a digital inventory of gene and mRNA isoform expression. Analyses in which sequence reads are mapped to exon-exon junctions indicated that 92-94% of human genes undergo alternative splicing, 86% with a minor isoform frequency of 15% or more. Differences in isoform-specific read densities indicated that most alternative splicing and alternative cleavage and polyadenylation events vary between tissues, whereas variation between individuals was approximately twofold to threefold less common. Extreme or 'switch-like' regulation of splicing between tissues was associated with increased sequence conservation in regulatory regions and with generation of full-length open reading frames. Patterns of alternative splicing and alternative cleavage and polyadenylation were strongly correlated across tissues, suggesting coordinated regulation of these processes, and sequence conservation of a subset of known regulatory motifs in both alternative introns and 3' untranslated regions suggested common involvement of specific factors in tissue-level regulation of both splicing and polyadenylation.


Figures

Figure 1
Figure 1. Frequency and relative abundance of AS isoforms in human genes
a, mRNA-SEQ reads mapping to a portion of the SCL25A3 gene locus. The number of mapped reads starting at each nucleotide position is displayed (log10) for the tissues listed at right. Arcs represent junctions detected by SJ reads (bold arcs for junctions supported by >10 reads). Below – exon/intron structures of representative transcripts (GenBank accessions shown at right). b, Mean fraction of multi-exon genes with detected AS in bins of 500 genes, grouped by total read count per gene. A gene was considered as alternatively spliced if SJ reads joining the same 5′SS to different 3′SS, or joining the same 3′SS to different 5′SS were observed. The true extent of AS was estimated from the upper asymptote of the best-fit sigmoid curve (red). c, Frequency of AS in top bin and after estimation (as in b), considering only events with relative expression of less abundant (minor) splice variant exceeding given threshold. Bars indicate SEM.
Figure 2
Figure 2. Pervasive tissue-specific regulation of alternative mRNA isoforms
Rows represent the 8 different alternative transcript event types diagrammed. Mapped reads supporting expression of upper isoform, lower isoform or both isoforms are shown in blue, red, and gray, respectively. Columns 1-4 show numbers of events of each type: (1) supported by cDNA and/or EST data; (2) with ≥ 1 isoform supported by mRNA-SEQ reads; (3) with both isoforms supported by reads; and (4) events detected as tissue-regulated (Fisher's exact test) at an FDR of 5%. Columns 5-6 show: (5) the observed percentage of events with both isoforms detected that were observed to be tissue-regulated; and (6) the estimated true percentage of tissue-regulated isoforms after correction for power to detect tissue bias and for the FDR (Fig. S3). For some event types, ‘common reads’ (gray bars) were used in lieu of (for tandem 3′ UTR events) or in addition to ‘exclusion’ reads for detection of changes in isoform levels between tissues.
Figure 3
Figure 3. The extent of individual-specific differences in alternative isoform expression
Spearman correlations of Ψ values for SEs in human tissues and cell lines. Correlations were computed separately for each pair of tissues and cell lines, and clustered according to similarity using average linkage hierarchical clustering.
Figure 4
Figure 4. Conservation and function of switch-like AS exons
a, Scatter plot showing Ψ values of SEs and MXEs for which switch score was determined based on comparison of heart (x-axis) and a second tissue (y-axis). Exons with switch score > 0.5 are shown as filled symbols, others as small gray dots. b, Cumulative distribution functions of switch scores for SEs and MXE pairs (P-value based on Kolmogorov-Smirnov test). c, Reading frame preservation of SEs and MXEs grouped by switch score. SEs with lengths divisible by 3 and MXE pairs with lengths differing by 0 or a multiple of 3 were considered to preserve reading frame. P-values based on Fisher's exact test. d, Conservation in SEs and flanking intron regions grouped by SE switch score. The mean per-position phastCons score (from alignment of 4 mammalian genomes) and SEM are shown. e, Enrichment of UGCAUG motifs near tissue-regulated SEs. Colored squares represent −log10(P-value) for the enrichment of UGCAUG counts relative to cohorts of control 6mers in regions surrounding SEs with significantly increased (red) or decreased (blue) inclusion in each tissue with respect to other tissues.
Figure 5
Figure 5. Evidence for coordination between splicing and polyadenylation
a, Mean and SEM of per-position phastCons score in the region 300 bp upstream of proximal and distal cleavage sites for tandem 3′ UTRs grouped by switch score. inset, Increased conservation of Fox-1/-2 motifs in tandem 3′ UTR extension regions. All non-CpG-containing 7mers (dotted line), miRNA seed matches (black), and 7mers containing UGCAUG (red) are shown. b, SVD analysis of SE inclusion levels across tissues and cell lines for SEs meeting minimum read coverage criteria in each of the 14 samples. Projections are shown in the dimensions corresponding to the two leading eigenvalues, which accounted for 25% of the variance. c, SVD analysis of tandem UTR inclusion levels (as in panel c). d, SVD analysis was conducted for the 14 samples based on Ψ values for the 5 indicated alternative transcript event types or based on gene expression values. Spearman correlations between corresponding pairwise distances in projections of the sort shown in panels b and c are shown. e, S:B ratios of non-CpG-containing 6mers in introns flanking SEs (x-axis) and in extended 3′ UTR regions (y-axis). The canonical PAS 6mer AAUAAA (black triangle), 6mers corresponding to seed matches to conserved mammalian miRNAs (black dots), and 6mers corresponding to binding motifs for the indicated splicing or 3′ UTR-binding factors (color) are shown.

References

    1. Black DL. Mechanisms of alternative pre-messenger RNA splicing. Annu Rev Biochem. 2003;72:291–336. - PubMed
    1. Matlin AJ, Clark F, Smith CW. Understanding alternative splicing: towards a cellular code. Nat Rev Mol Cell Biol. 2005;6:386–98. - PubMed
    1. Lander ES, et al. Initial sequencing and analysis of the human genome. Nature. 2001;409:860–921. - PubMed
    1. Johnson JM, et al. Genome-wide survey of human alternative pre-mRNA splicing with exon junction microarrays. Science. 2003;302:2141–4. - PubMed
    1. Blencowe BJ. Alternative splicing: new insights from global analyses. Cell. 2006;126:37–47. - PubMed

Publication types

Associated data