. 2008 Nov;26(11):1293-300.
doi: 10.1038/nbt.1505. Epub 2008 Nov 2.

An integrated software system for analyzing ChIP-chip and ChIP-seq data

Affiliations

An integrated software system for analyzing ChIP-chip and ChIP-seq data

Hongkai Ji et al. Nat Biotechnol. 2008 Nov.

Abstract

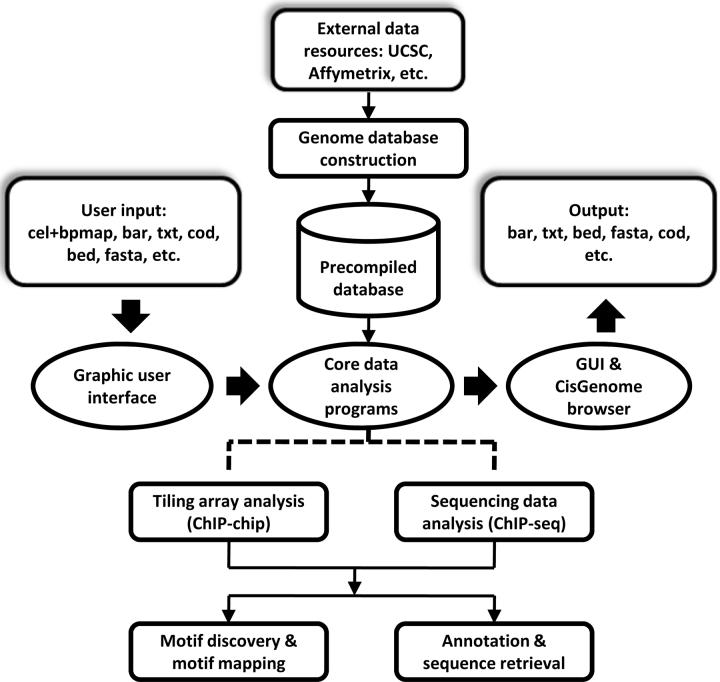
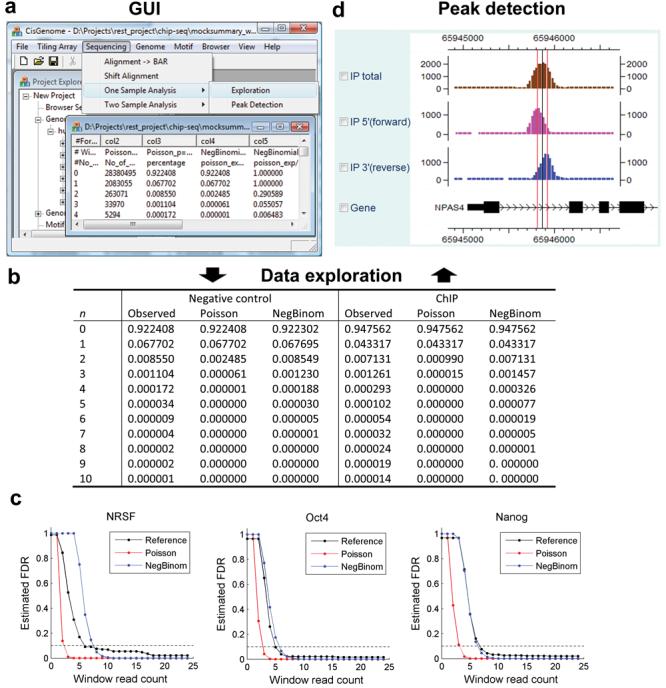
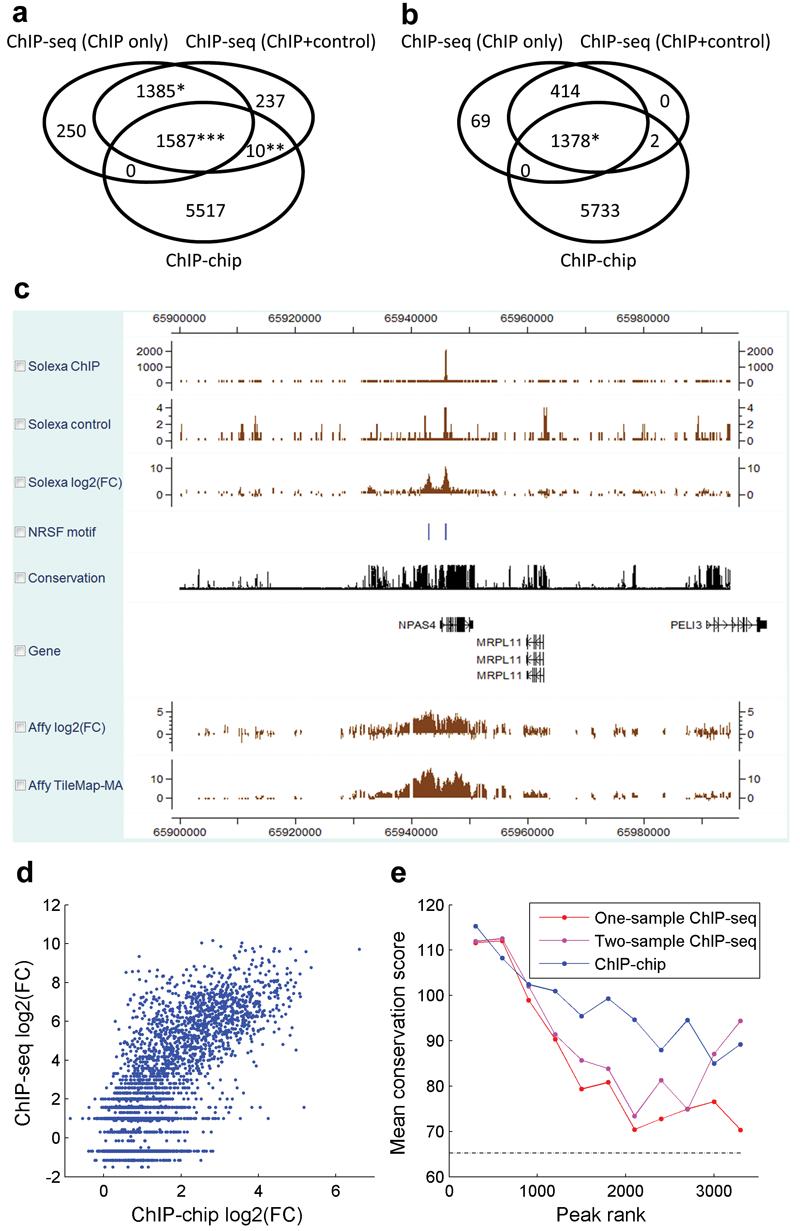
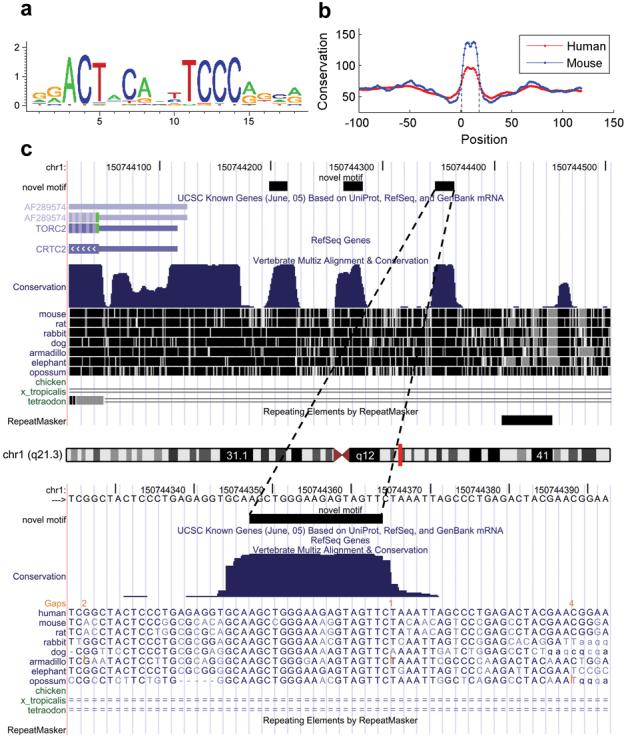
We present CisGenome, a software system for analyzing genome-wide chromatin immunoprecipitation (ChIP) data. CisGenome is designed to meet all basic needs of ChIP data analyses, including visualization, data normalization, peak detection, false discovery rate computation, gene-peak association, and sequence and motif analysis. In addition to implementing previously published ChIP-microarray (ChIP-chip) analysis methods, the software contains statistical methods designed specifically for ChlP sequencing (ChIP-seq) data obtained by coupling ChIP with massively parallel sequencing. The modular design of CisGenome enables it to support interactive analyses through a graphic user interface as well as customized batch-mode computation for advanced data mining. A built-in browser allows visualization of array images, signals, gene structure, conservation, and DNA sequence and motif information. We demonstrate the use of these tools by a comparative analysis of ChIP-chip and ChIP-seq data for the transcription factor NRSF/REST, a study of ChIP-seq analysis with or without a negative control sample, and an analysis of a new motif in Nanog- and Sox2-binding regions.


Figures

Figure 1
Figure 1. The basic framework of CisGenome
CisGenome contains three core components: a graphic user interface (GUI), a built-in browser (CisGenome browser), and a set of underlying data analysis algorithms. The GUI allows users to load raw data and choose specific analysis functions. Core programs will be called to perform the analysis. Results are displayed in the CisGenome browser and can be exported in various formats. Pre-compiled genome databases are required to support analyses involving sequence and gene annotation information. CisGenome contains functions to construct such databases from standard external data resources. Databases for a few commonly used species can be downloaded directly from the CisGenome website.
Figure 2
Figure 2. ChIP-seq data processing
(a) Users can use GUI to explore and analyze ChIP-seq data. (b) In data exploration, parametric models are fitted to describe the distribution of read count n in background windows. Both negative control samples and the lower end of ChIP samples can be fitted well by the negative binomial model, while the poisson model generally fails to provide satisfactory fitting. Fitting to the NRSF data is shown as an example. (c) In one-sample analyses of NRSF, Oct4 and Nanog data, FDR estimates based on the negative binomial and poisson models were compared to model-independent reference FDRs. The reference FDRs were obtained by incorporating information from negative control samples. They were defined as (No. of predictions in the control sample / No. of predictions in the corresponding ChIP sample with equal amount of reads). (d) Peak detection results can be visualized using CisGenome browser. 5′ reads that are aligned to the forward strand of genome (pink) and 3′ reads aligned to the reverse complement strand of the genome (blue) are usually shifted away from each other and form two separate peaks due to the nature of sequencing (Supplementary Fig. 1). CisGenome uses the modes (red vertical lines) of the 5′ and 3′ peaks to refine the boundaries of binding regions (boundary refinement) and reports the center (black vertical line) as well. CisGenome can also filter out low-quality binding regions if 5′ and 3′ peaks did not show up as a pair (single strand filtering).
Figure 3
Figure 3. Comparisons between NRSF ChIP-seq and ChIP-chip
(a) Overlap among ChIP-chip and ChIP-seq binding regions before applying boundary refinement and single strand filtering. ‘*’: Since a peak from one dataset can overlap multiple peaks from another dataset, the intersection involved 1,385 one-sample and 1,387 two-sample ChIP-seq peaks. ‘**’: 10 ChIP-chip peaks, 22 two-sample ChIP-seq peaks. ‘***’: 1,587 ChIP-chip peaks, 1,677 one-sample and 1,671 two-sample ChIP-seq peaks. (b) Overlap among ChIP-chip and ChIP-seq binding regions after applying post-processing to ChIP-seq data. (*) 1,378 ChIP-seq and 1,379 ChIP-chip peaks overlapped. (c) A visual comparison of ChIP-seq and ChIP-chip signals in CisGenome browser. (d) Using CisGenome, the NRSF motif was mapped to the human genome, and log2 (IP/control) fold changes were extracted for the motif sites from both ChIP-chip and ChIP-seq. Comparison of these site-level signals revealed a strong correlation between ChIP-chip and ChIP-seq (ρ=0.73). The CisGenome functions used here can be applied to construct genome-wide tissue-specific activity maps of transcription factor binding motifs in future studies. (e) The conservation levels of ChIP-chip and ChIP-seq binding regions were higher than the corresponding conservation level of randomly chosen non-repeat genomic regions (dotted line). The ranked binding regions were grouped into tiers (tier size = 300). Mean phastCons conservation score was computed for each tier (see Methods). The figure characterizes the conservation at the binding region level rather than motif site level. Results were obtained before post-processing. Applying post-processing to ChIP-seq produced similar results (data not shown).
Figure 4
Figure 4. Analysis of a novel motif
(a) Sequence logo of the motif visualized using CisGenome browser. (b) Mean phastCons scores for the motif and flanking positions were extracted using CisGenome (Supplementary Fig. 12d). The score drops sharply at the motif boundaries which are indicated by two dotted vertical lines. (c) A typical example of clustered motif sites. Sites are indicated by the black blocks in the novel motif track. They coincide well with conserved genomic elements. The example is shown using UCSC genome browser to illustrate that CisGenome allows users to link to external web resources (Supplementary Fig. 12c).

References

    1. Cawley S, et al. Unbiased mapping of transcription factor binding sites along human chromosomes 21 and 22 points to widespread regulation of noncoding RNAs. Cell. 2004;116:499–509. - PubMed
    1. Boyer LA, et al. Core transcriptional regulatory circuitry in human embryonic stem cells. Cell. 2005;122:947–956. - PMC - PubMed
    1. Carroll JS, et al. Genome-wide analysis of estrogen receptor binding sites. Nat. Genet. 2006;38:1289–1297. - PubMed
    1. Johnson DS, Mortazavi A, Myers RM, Wold B. Genome-wide mapping of in vivo protein-DNA interactions. Science. 2007;316:1497–1502. - PubMed
    1. Robertson G, et al. Genome-wide profiles of STAT1 DNA association using chromatin immunoprecipitation and massively parallel sequencing. Nat. Methods. 2007;4:651–657. - PubMed

Publication types

Substances