

Meta-Analysis
doi: 10.1038/ng.273.
Epub 2008 Nov 2.
Common 5p15.33 and 6p21.33 variants influence lung cancer risk
Affiliations
- PMID: 18978787
- PMCID: PMC2695928
- DOI: 10.1038/ng.273
Item in Clipboard
Meta-Analysis
Common 5p15.33 and 6p21.33 variants influence lung cancer risk
Nat Genet.
2008 Dec.
Abstract
We conducted a genome-wide association (GWA) study of lung cancer comparing 511,919 SNP genotypes in 1,952 cases and 1,438 controls. The most significant association was attained at 15q25.1 (rs8042374; P = 7.75 x 10(-12)), confirming recent observations. Pooling data with two other GWA studies (5,095 cases, 5,200 controls) and with replication in an additional 2,484 cases and 3,036 controls, we identified two newly associated risk loci mapping to 6p21.33 (rs3117582, BAT3-MSH5; P(combined) = 4.97 x 10(-10)) and 5p15.33 (rs401681, CLPTM1L; P(combined) = 7.90 x 10(-9)).
Figures
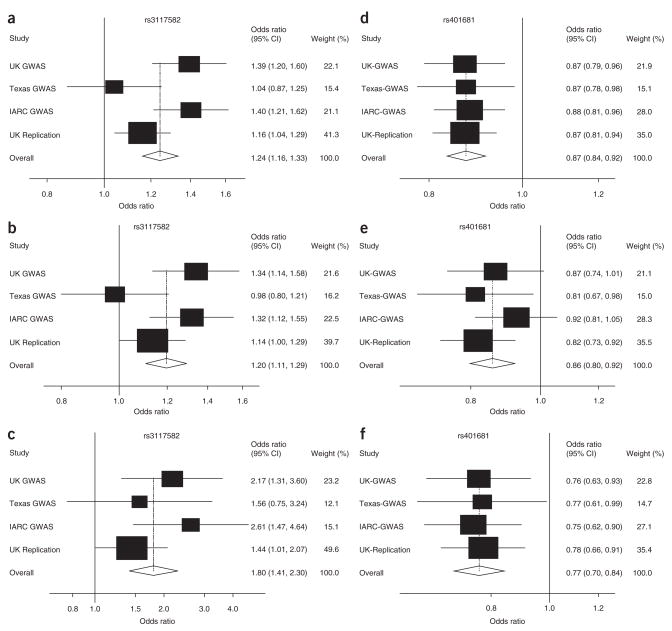
Summary of association results for rs3117582 and rs401681. (a–f) Forest plots of rs3117582 per allele ORs (a), heterozygote ORs (b) and homozygote ORs (c); and rs401681 per allele ORs (d), heterozygote ORs (e) and homozygote ORs (f). The x axis corresponds to the odds ratio (OR). Horizontal lines represent 95% confidence intervals. Each box represents the OR point estimate and its area is proportional to the statistical weight of the study. The diamonds (and broken lines) represent the summary odds ratios obtained from fixed-effect pooled analysis with 95% confidence intervals given by their widths. The unbroken vertical line is at the null value (OR = 1.0). Frequencies of CC, CA and AA rs3117582 genotypes in cases and controls in the UK-Replication series were 65, 609, 1,774 and 57, 679, 2,247, respectively. Frequencies of AA, AG and GG rs401681 genotypes in cases and controls in the UK-Replication series were 394, 1,134, 868 and 551, 1,506, 994, respectively.
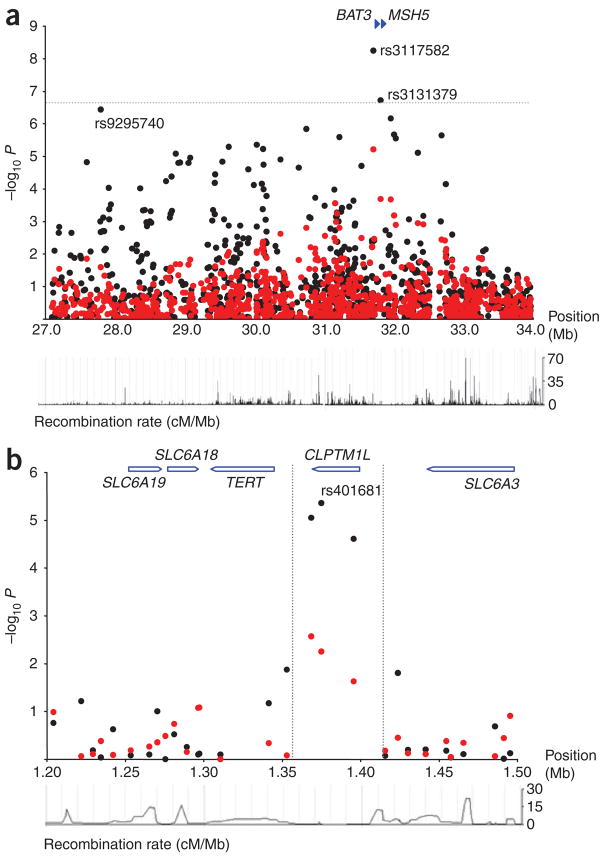
LD structure and association results for the two confirmed lung cancer–associated regions. (a) 6p21.33–6p22.1. (b) 5p15.33. Chromosomal positions based on NCBI build 36 coordinates, showing Ensembl (release 48) genes. P values (as –log10 values; y axis) are shown for SNPs analyzed in UK-GWA study (red circles). Mantel-Haenzel association test P values are also shown (black circles). Estimated recombination rates (taken from HapMap) are plotted to reflect the local LD structure around associated SNPs. Annotations of selected genes were taken from the University of California Santa Cruz Genome Browser.
References
Publication types
MeSH terms
Grants and funding
LinkOut - more resources
Full Text Sources
Other Literature Sources
Medical
Molecular Biology Databases
