. 2008 Dec;9(12):1379-87.
doi: 10.1038/ni.1666. Epub 2008 Nov 2.

Tonic B cell antigen receptor signals supply an NF-kappaB substrate for prosurvival BLyS signaling

Affiliations

Tonic B cell antigen receptor signals supply an NF-kappaB substrate for prosurvival BLyS signaling

Jason E Stadanlick et al. Nat Immunol. 2008 Dec.

Abstract

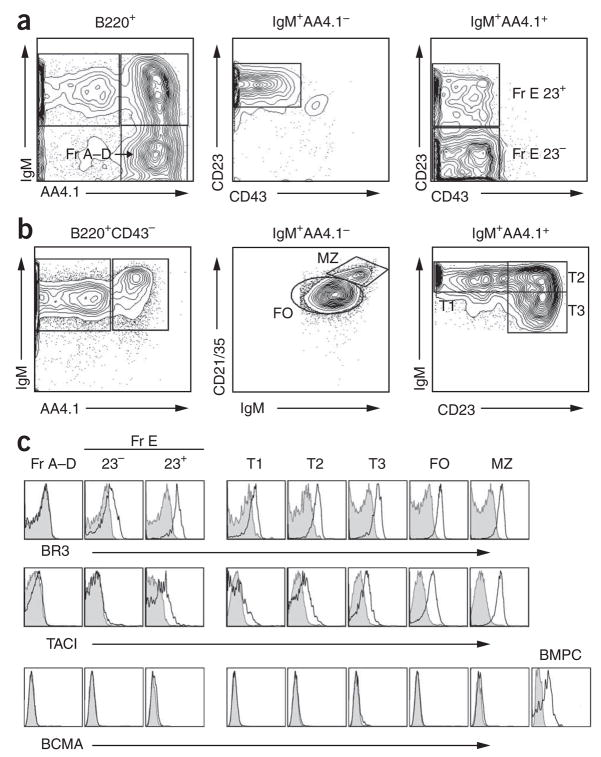
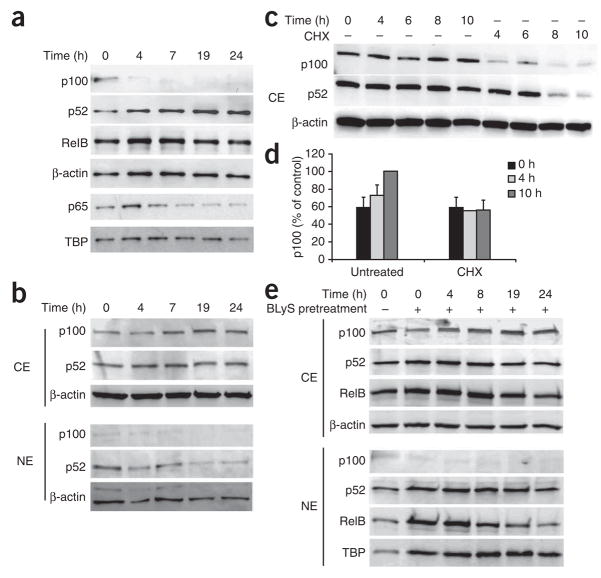
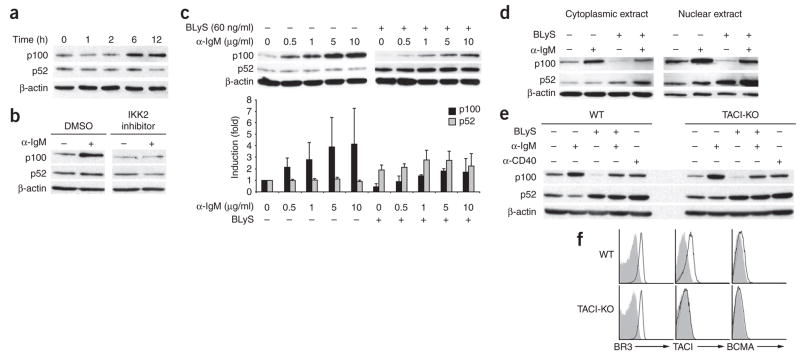
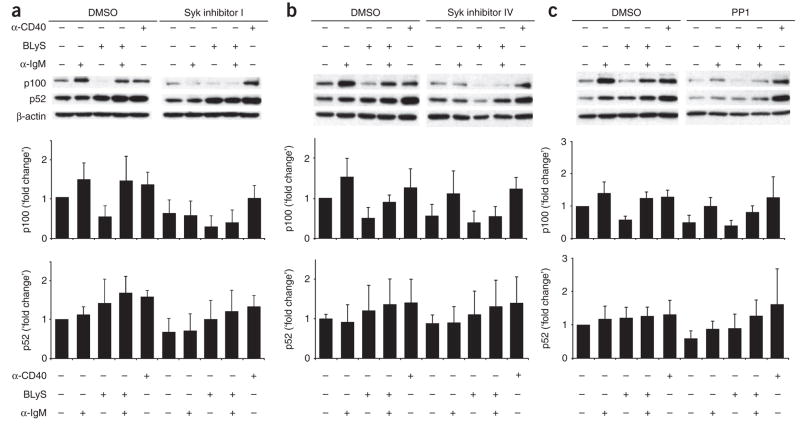
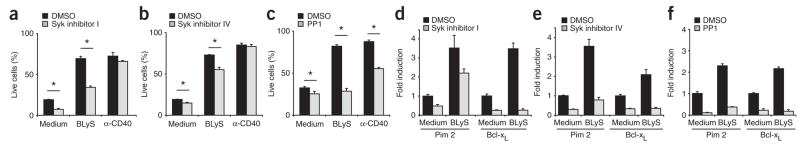
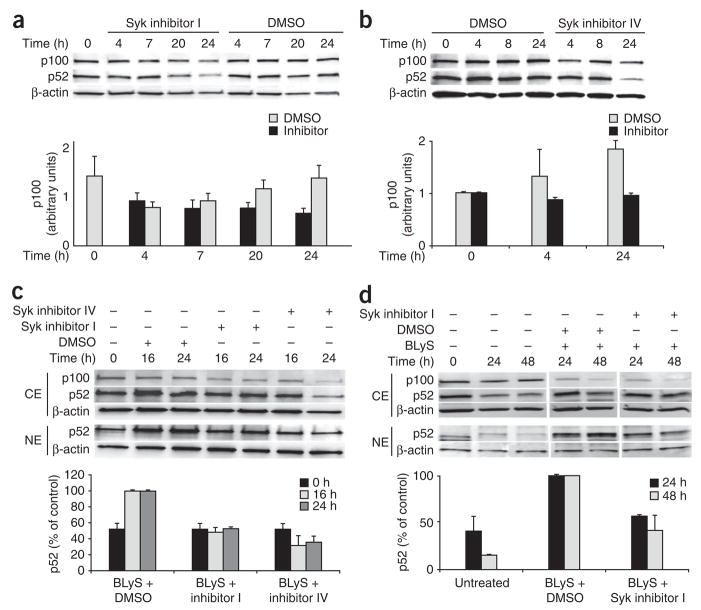
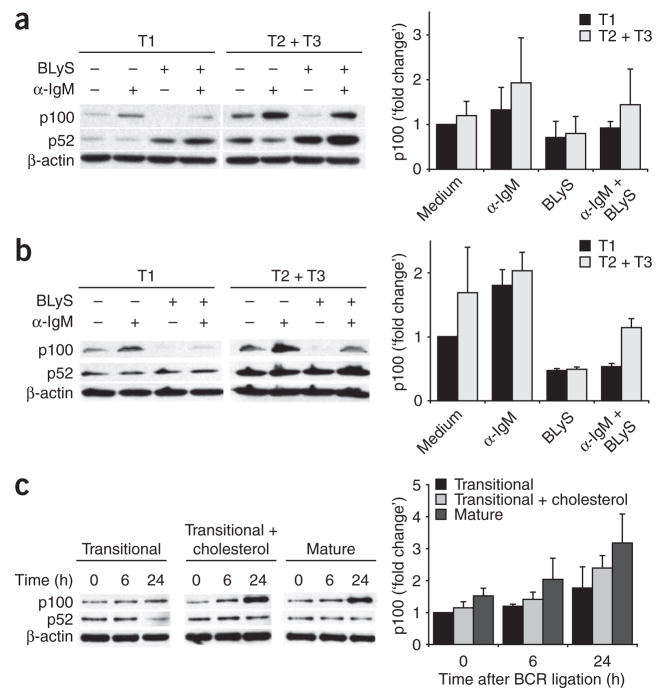
The survival of transitional and mature B cells requires both the B cell antigen receptor (BCR) and BLyS receptor 3 (BR3), which suggests that these receptors send signals that are nonredundant or that engage in crosstalk with each other. Here we show that BCR signaling induced production of the nonclassical transcription factor NF-kappaB pathway substrate p100, which is required for transmission of BR3 signals and thus B cell survival. The capacity for sustained p100 production emerged during transitional B cell differentiation, the stage at which BCR signals begin to mediate survival rather than negative selection. Our findings identify a molecular mechanism for the reliance of primary B cells on continuous BR3 and BCR signaling, as well as for the gradual resistance to negative selection that is acquired during B cell maturation.


Figures

Figure 1
Figure 1
BLyS expression on splenic and bone marrow B cells. (a,b) Staining used to identify developmental B cell subsets in bone marrow (a) and splenic (b) populations. (c) Surface expression of BR3, TACI and BCMA on bone marrow and splenic B cell subsets (open histograms). Shaded histograms, isotype-matched control antibody. BMPC, bone marrow plasma cells (positive control for BCMA surface expression). Fr A–D, Hardy fractions A–D; Fr E, Hardy fraction E; 23, CD23; 23+, CD23+, FO, follicular; MZ, marginal zone. Data are representative of at least three independent experiments.
Figure 2
Figure 2
Continuous BLyS signaling is required for p100 processing and sustained nuclear accumulation of p52. (a) Immunoblot analysis of nuclear extracts of CD43 splenic B cells cultured for 0–24 h (above lanes) with BLyS (100 ng/ml). Results are representative of five independent experiments. (b,c) Immunoblot analysis of cytoplasmic extracts (CE) and nuclear extracts (NE) of CD43 splenic B cells incubated for various times (above lanes) in medium alone (b) or in the presence of cycloheximide (CHX; 10 μg/ml; c). Results are representative of three experiments. (d) Expression of p100 in cytoplasmic extracts of B cells left untreated or treated with cycloheximide, presented as a proportion of the p100 expression in untreated cells at 10 h (control). Data are from three independent experiments (mean and s.d.). (e) Immunoblot analysis of cytoplasmic and nuclear extracts of CD43 splenic B cells left untreated (−) or pretreated for 24 h with BLyS (100 ng/ml; +), then washed extensively to remove exogenous BLyS and incubated for various times (above lanes) in medium alone. TATA-binding protein (TBP) and β-actin serve as loading controls. Data are representative of three independent experiments.
Figure 3
Figure 3
NF-κB crosstalk ‘downstream’ of BCR and BR3 signaling in follicular B cells. (a) Immunoblot analysis of lysates of CD23+ follicular cells cultured for various times (above lanes) with antibody to IgM F(ab′)2 (10 μg/ml). (b) Immunoblot analysis of lysates of CD23+ follicular B cells cultured for 18 h in medium alone (−) or with anti-IgM (α-IgM; 10 μg/ml; +) in the presence of an inhibitor of the classical pathway component IKK2 or an equivalent volume of DMSO. (c) Immunoblot analysis (top) of lysates of CD23+ follicular B cells cultured for 24 h with various concentrations (above lanes) of anti-IgM alone (left) or with BLyS (60 ng/ml; right). Below, band intensities normalized to β-actin and presented as expression relative to that of cells cultured in medium alone. (d) Immunoblot analysis of lysates of CD23+ B cells stimulated for 24 h with BLyS (60 ng/ml) and/or anti-IgM (10 μg/ml). (e) Immunoblot analysis of lysates of wild-type (WT) or TACI-deficient (TACI-KO) B cells cultured for 24 h with various stimuli (above lanes). β-actin serves as a loading control in all blots. (f) Flow cytometry of the surface expression of BLyS receptors on wild-type and TACI-deficient B cells (open histograms). Shaded histograms, isotype-matched control antibody. Data are representative of at least three independent experiments (ae; mean and s.d., c) or ten experiments (f).
Figure 4
Figure 4
BCR signaling blockade decreases tonic and anti-IgM–stimulated p100 generation. Immunoblot analysis (top) of nuclear extracts of C57BL/6 CD23+ follicular B cells stimulated for 24 h with anti-IgM (10 μg/ml), BLyS (100 ng/ml) and/or anti-CD40 (10 μg/ml), along with a chemical inhibitor of Syk (I or IV) or Src (PP1) or an equivalent volume of DMSO. β-actin serves as a loading control. Below blots, band intensity relative to that of cells incubated in medium alone. Data are representative of at least three independent experiments (mean and s.d.).
Figure 5
Figure 5
BCR signaling blockade decreases BLyS-mediated signaling and long-term survival. (ac) Viability of CD23+ B cells cultured for 72 h with medium alone, BLyS (100 ng/ml) or anti-CD40 (10 μg/ml) in the presence of DMSO or a chemical inhibitor of Syk (I or IV) or Src (PP1), assessed by TO-PRO-3 exclusion. *, P, 0.05. (df) Real time PCR analysis of the expression of Pim2 mRNA and Bcl-xL mRNA in CD23+ B cells cultured for 24 h with medium alone, BLyS (100 ng/ml) or anti-CD40 (10 μg/ml) in the presence of DMSO or inhibitors of Syk or Src (as in ac). Results are normalized to GAPDH expression and are presented relative to expression in cells incubated in medium alone (arbitrary units). Data are representative of at least two independent experiments (mean and s.d. of triplicate wells).
Figure 6
Figure 6
Effect of blocking tonic BCR signals on nonclassical NF-κB components. (a,b) Immunoblot analysis (top) of cytoplasmic extracts of CD43 splenic B cells cultured with 10 μM Syk inhibitor I (a), 50 nM Syk inhibitor IV (b) or an equivalent volume of DMSO. β-actin serves as a loading control. Below blots, cytoplasmic p100, presented relative to β-actin. (c,d) Immunoblot analysis (top) of cytoplasmic and nuclear extracts of wild-type (c) or Bcl-xL-transgenic (d) splenic B cells incubated for various times (above lanes) with or without BLyS (100 ng/ml) in the presence or absence of Syk inhibitors I or IV or DMSO. Below blots, nuclear p52, presented as a proportion of the amount in cells treated with BLyS alone. β-actin serves as a loading control in all blots. Data are representative of two or more independent experiments (blots, ad), five independent experiments (graph, a; mean and s.d.) or two independent experiments (graphs, bd; mean and range).
Figure 7
Figure 7
T1 B cells have a diminished capacity to upregulate p100 after BCR stimulation in vitro. (a) Immunoblot analysis of whole-cell lysates of T1 B cells (B220+ AA4.1+ CD23) or T2 and T3 B cells (B220+AA4.1+CD23+) sorted by flow cytometry from C57BL/6 splenocytes in low-pressure conditions (15 psi) and treated for 24 h with anti-IgM or BLyS. (b) Immunoblot analysis of splenic transitional B cells from Bcl-xL-transgenic mice irradiated (5 Gy) 13.5 d before cell collection to enrich for transitional B cells; cells were sorted, treated and analyzed as described in a. Right (a,b), p100 band intensity relative to that of untreated T1 cells. (c) Immunoblot analysis of CD43-depleted transitional B cells obtained from C57BL/6 spleens 13.5 d after 5 Gy of whole-body irradiation, followed by the addition of cholesterol by means of treatment with 5 mM methyl-β-cyclodextran, then stimulation of untreated transitional cells, follicular cells or transitional cells with added cholesterol with anti-IgM for 0–24 h (above lanes and below bars) and analysis as described in a. Right, p100 band intensity relative to that of untreated transitional cells at time 0. Data are representative of two or more independent experiments (blots, ac), two independent experiments (graphs, a,b; mean and range) or three independent experiments (graph, c; mean and s.d.).

References

    1. Moore PA, et al. BLyS: member of the tumor necrosis factor family and B lymphocyte stimulator. Science. 1999;285:260–263. - PubMed
    1. Schneider P, et al. BAFF, a novel ligand of the tumor necrosis factor family, stimulates B cell growth. J Exp Med. 1999;189:1747–1756. - PMC - PubMed
    1. Lam KP, Kuhn R, Rajewsky K. In vivo ablation of surface immunoglobulin on mature B cells by inducible gene targeting results in rapid cell death. Cell. 1997;90:1073–1083. - PubMed
    1. Batten M, et al. BAFF mediates survival of peripheral immature B lymphocytes. J Exp Med. 2000;192:1453–1466. - PMC - PubMed
    1. Yan M, et al. Identification of a novel receptor for B lymphocyte stimulator that is mutated in a mouse strain with severe B cell deficiency. Curr Biol. 2001;11:1547–1552. - PubMed

Publication types