Comment
. 2008 Nov;10(11):1235-7; author reply 1237-40.
doi: 10.1038/ncb1108-1235.

UCPs--unlikely calcium porters

Comment

UCPs--unlikely calcium porters

Paul S Brookes et al. Nat Cell Biol. 2008 Nov.
No abstract available


Figures

Figure 1
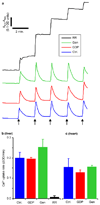
Figure 1. Ca2+ uptake by liver and heart mitochondria; effect of UCP inhibitors
Mitochondria were isolated from rat heart or liver as described in the supplemental information, and extra-mitochondrial [Ca2+] was measured using the Ca2+ sensitive dye Arsenazo III. Mitochondria were energized with succinate (complex II), with rotenone present to inhibit complex I. a. Representative Ca2+ traces for liver mitochondria. Each arrow represents addition of a Ca2+ bolus (20 µM final) to the incubation, resulting in an increase in extra-mitochondrial [Ca2+] followed by a decrease as Ca2+ is sequestered into mitochondria. Where indicated, inhibitors were present as follows: 1mM GDP (UCP inhibitor), 50 µM genipin (Gen, UCP2 inhibitor), 1 µM crude RR (MCU inhibitor). b. Quantitation of liver mitochondrial Ca2+ uptake rate (i.e. initial downward slope following Ca2+ spike), from experiments as shown in a. The average of second and third Ca2+ spikes from each trace was used for quantitation. Data are means ± SEM, N=3 (each N was an independent mitochondrial preparation on a separate day). c. As in b, data from heart mitochondria.
Figure 2
Figure 2. Ca2+ uptake in SkM mitochondria from wild-type (WT) and Ucp3−/− mice, plus liver and kidney mitochondria from wild-type and Ucp2−/− mice
Mitochondria were isolated and Ca2+ uptake measured as described in the supplemental information. a. Representative Ca2+ uptake traces in mitochondria from WT (blue) and Ucp3−/− (red) mouse SkM. Ca2+ (10 µM), FCCP (1 µM), and EGTA (1 mM) were added as indicated by arrows. Each trace is an average of 3 repeats on 1 preparation (N=1). b. Ca2+ uptake rates calculated from initial downward slopes of Ca2+ traces in a. The average of first and second Ca2+ spikes from each trace was used for quantitation. Data are means ± SEM, N=3 (where each N was an independent mitochondrial preparation on a separate day). There was no significant difference between WT and Ucp3−/− (Student’s t test). c. Ca2+ uptake studies in mitochondria isolated from WT (blue) and Ucp2−/− (red) mouse liver. Each trace is an average of 3 repeats on 1 preparation (N=1). This experiment is essentially identical in design to that shown in Figure 3 of [2], but gives a different result. d. Ca2+ uptake studies in mitochondria isolated from WT (blue) and Ucp2−/− (red) mouse kidney. Each trace is an average of 3 repeats on 1 preparation (N=1). N.B. in all panels, open/filled symbols represent the absence/presence, respectively, of crude RR (10 µM).

Comment on

References

    1. Kirichok Y, Krapivinsky G, Clapham DE. Nature. 2004;427:360–364. - PubMed
    1. Trenker M, Malli R, Fertschai I, Levak-Frank S, Graier WF. Nature Cell Biol. 2007;9:445–452. - PMC - PubMed
    1. Graier WF, Frieden M, Malli R. Pflugers Arch. 2007;455:375–396. - PMC - PubMed
    1. Gunter TE, Buntinas L, Sparagna G, Eliseev R, Gunter K. Cell Calcium. 2000;28:285–296. - PubMed
    1. Stuart JA, Harper JA, Brindle KM, Jekabsons MB, Brand MD. Biochem. J. 2001;356:779–789. - PMC - PubMed