

Life, Information, Entropy, and Time: Vehicles for Semantic Inheritance
- PMID: 18978960
- PMCID: PMC2577055
- DOI: 10.1002/cplx.20180
Life, Information, Entropy, and Time: Vehicles for Semantic Inheritance
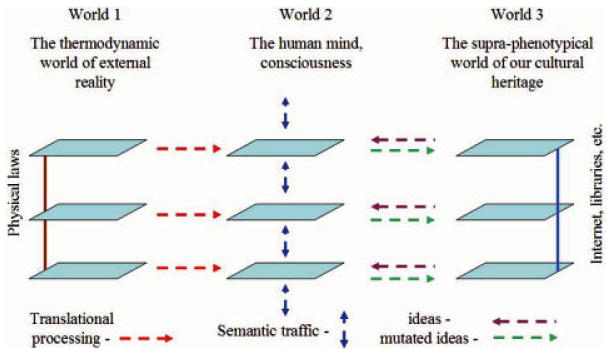
Abstract
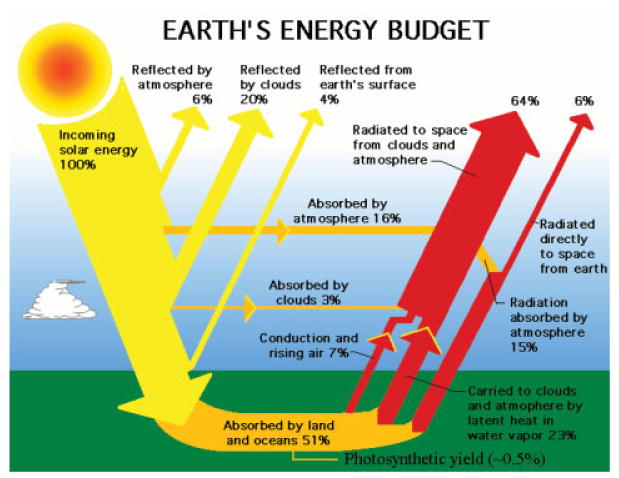
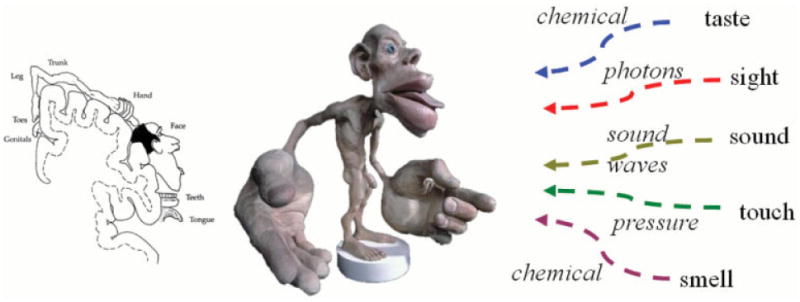
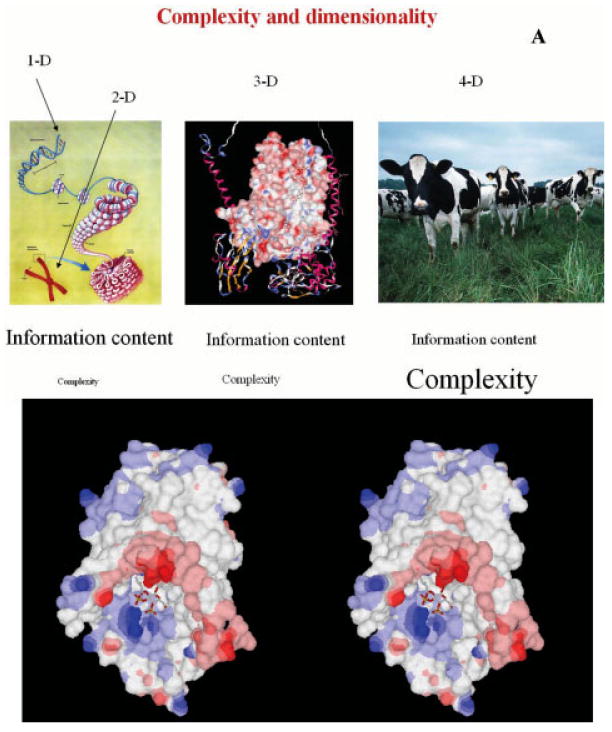
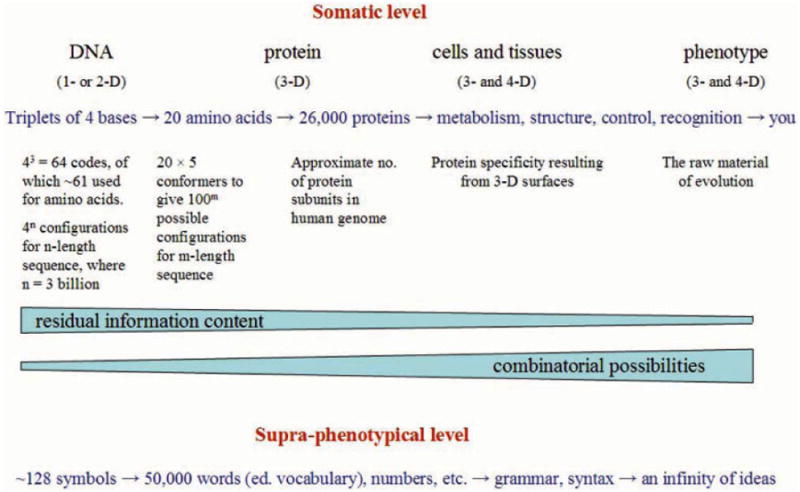
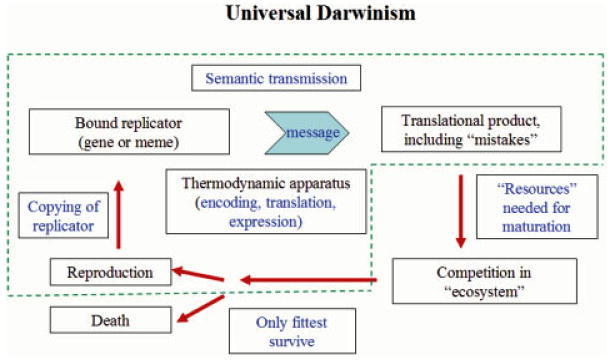
Attempts to understand how information content can be included in an accounting of the energy flux of the biosphere have led to the conclusion that, in information transmission, one component, the semantic content, or "the meaning of the message," adds no thermodynamic burden over and above costs arising from coding, transmission and translation. In biology, semantic content has two major roles. For all life forms, the message of the genotype encoded in DNA specifies the phenotype, and hence the organism that is tested against the real world through the mechanisms of Darwinian evolution. For human beings, communication through language and similar abstractions provides an additional supra-phenotypic vehicle for semantic inheritance, which supports the cultural heritages around which civilizations revolve. The following three postulates provide the basis for discussion of a number of themes that demonstrate some important consequences. (i) Information transmission through either pathway has thermodynamic components associated with data storage and transmission. (ii) The semantic content adds no additional thermodynamic cost. (iii) For all semantic exchange, meaning is accessible only through translation and interpretation, and has a value only in context. (1) For both pathways of semantic inheritance, translational and copying machineries are imperfect. As a consequence both pathways are subject to mutation and to evolutionary pressure by selection. Recognition of semantic content as a common component allows an understanding of the relationship between genes and memes, and a reformulation of Universal Darwinism. (2) The emergent properties of life are dependent on a processing of semantic content. The translational steps allow amplification in complexity through combinatorial possibilities in space and time. Amplification depends on the increased potential for complexity opened by 3D interaction specificity of proteins, and on the selection of useful variants by evolution. The initial interpretational steps include protein synthesis, molecular recognition, and catalytic potential that facilitate structural and functional roles. Combinatorial possibilities are extended through interactions of increasing complexity in the temporal dimension. (3) All living things show a behavior that indicates awareness of time, or chronognosis. The ∼4 billion years of biological evolution have given rise to forms with increasing sophistication in sensory adaptation. This has been linked to the development of an increasing chronognostic range, and an associated increase in combinatorial complexity. (4) Development of a modern human phenotype and the ability to communicate through language, led to the development of archival storage, and invention of the basic skills, institutions and mechanisms that allowed the evolution of modern civilizations. Combinatorial amplification at the supra-phenotypical level arose from the invention of syntax, grammar, numbers, and the subsequent developments of abstraction in writing, algorithms, etc. The translational machineries of the human mind, the "mutation" of ideas therein, and the "conversations" of our social intercourse, have allowed a limited set of symbolic descriptors to evolve into an exponentially expanding semantic heritage. (5) The three postulates above open interesting epistemological questions. An understanding of topics such dualism, the élan vital, the status of hypothesis in science, memetics, the nature of consciousness, the role of semantic processing in the survival of societies, and Popper's three worlds, require recognition of an insubstantial component. By recognizing a necessary linkage between semantic content and a physical machinery, we can bring these perennial problems into the framework of a realistic philosophy. It is suggested, following Popper, that the ∼4 billion years of evolution of the biosphere represents an exploration of the nature of reality at the physicochemical level, which, together with the conscious extension of this exploration through science and culture, provides a firm epistemological underpinning for such a philosophy.
Figures


References
-
- Broda E. Ludwig Boltzmann-Man-Physicist-Philosopher. Oxbow Press; Woodbridge: 1983.
-
- Crofts AR, Wraight CA, Fleischman DE. Energy conservation in the photochemical reactions of photosynthesis and its relation to delayed fluorescence. FEBS Lett. 1971;15:89–100. - PubMed
-
- Lavergne J. Commentary on: Photosynthesis and negative entropy production, by Jennings and coworkers. Biochim Biophys Acta. 2006;1757:1453–1459. - PubMed
-
- Nemani RR, Keeling CD, Hashimoto H, Jolly WM, Piper SC, Tucker CJ, Myrneni RB, Running SW. Climate-driven increases in global terrestrial net primary production from 1982 to 1999. Science. 2003;300:1560–1563. - PubMed
-
- Running SW, Nemani RR, Heinisch FA, Zhao M, Reeves M, Hashimoto H. A continuous satellite-derived measure of global terrestrial primary productivity. Bioscience. 2004;54:547–560.
Grants and funding
LinkOut - more resources
Full Text Sources
Research Materials