. 2009 Feb;322(1-2):53-62.
doi: 10.1007/s11010-008-9939-6. Epub 2008 Nov 1.

Inhibition of matrix metalloproteinases improves left ventricular function in mice lacking osteopontin after myocardial infarction

Affiliations

Inhibition of matrix metalloproteinases improves left ventricular function in mice lacking osteopontin after myocardial infarction

Prasanna Krishnamurthy et al. Mol Cell Biochem. 2009 Feb.

Abstract

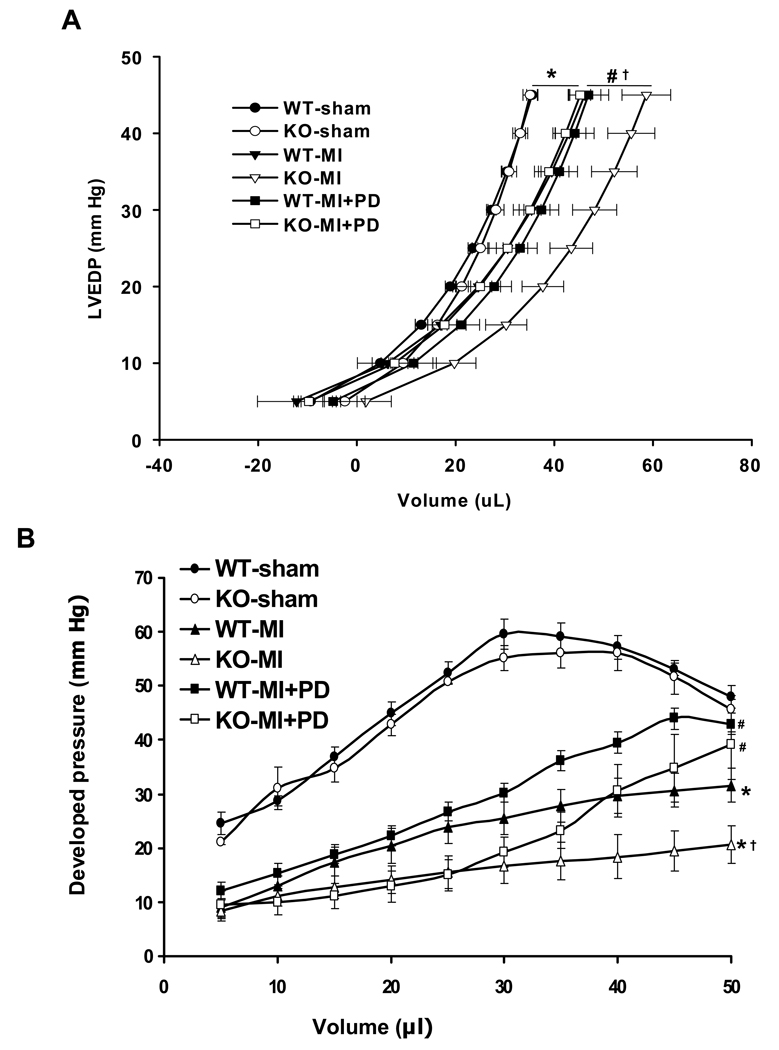
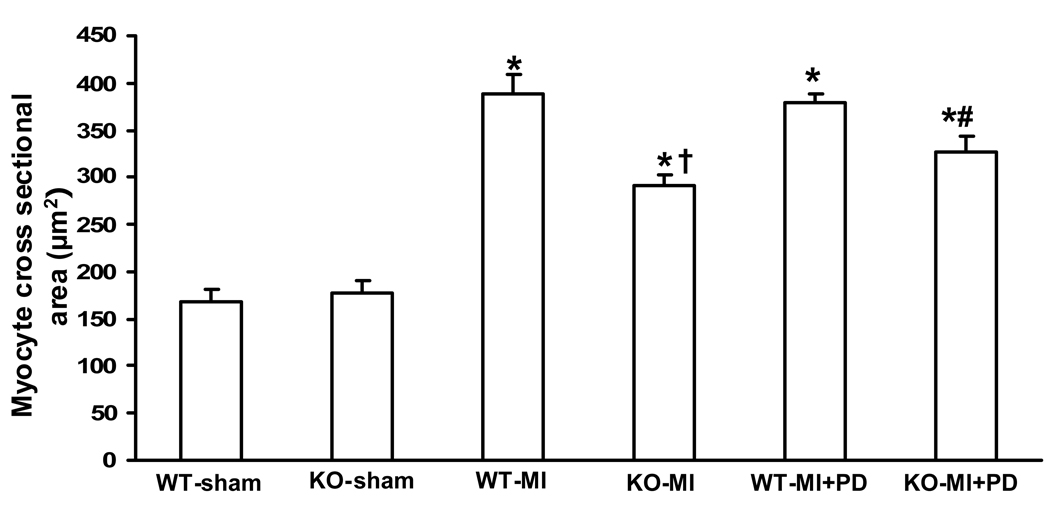
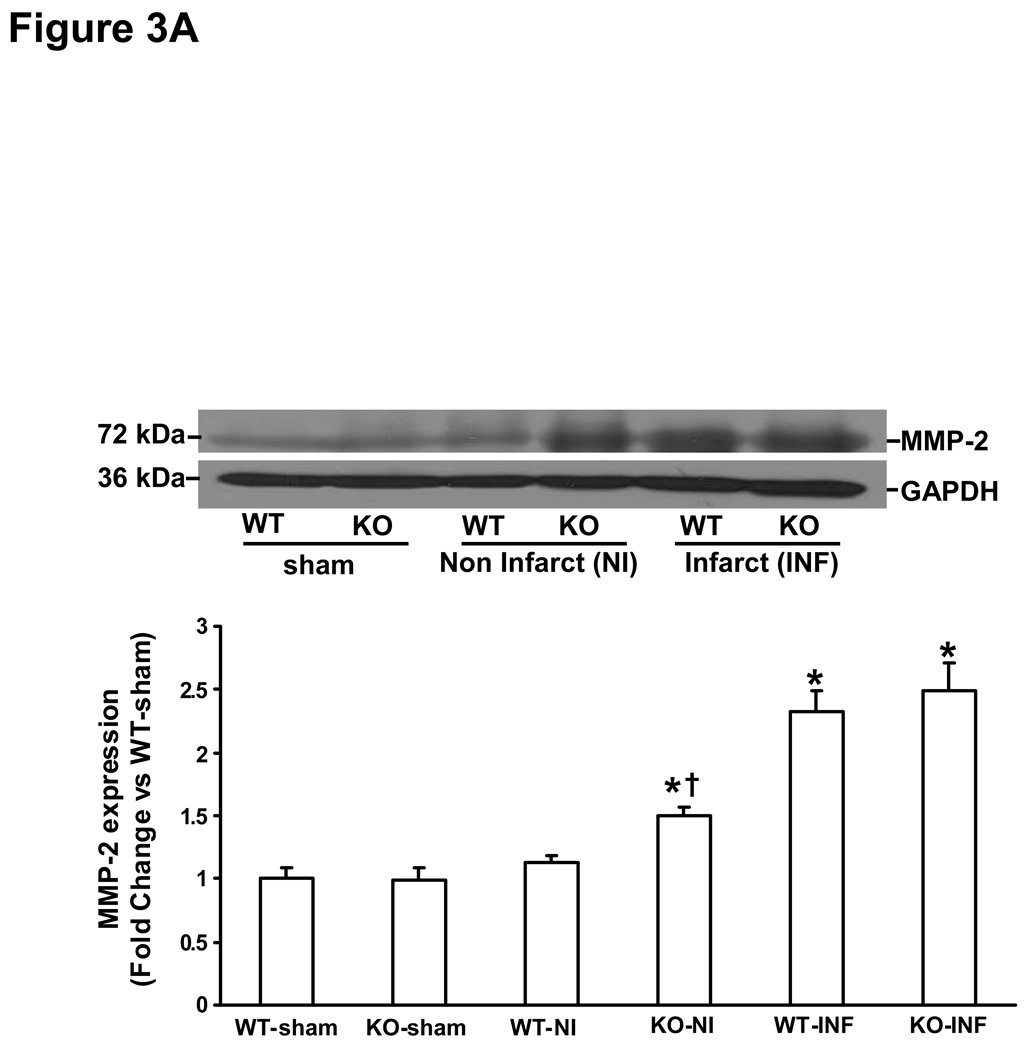
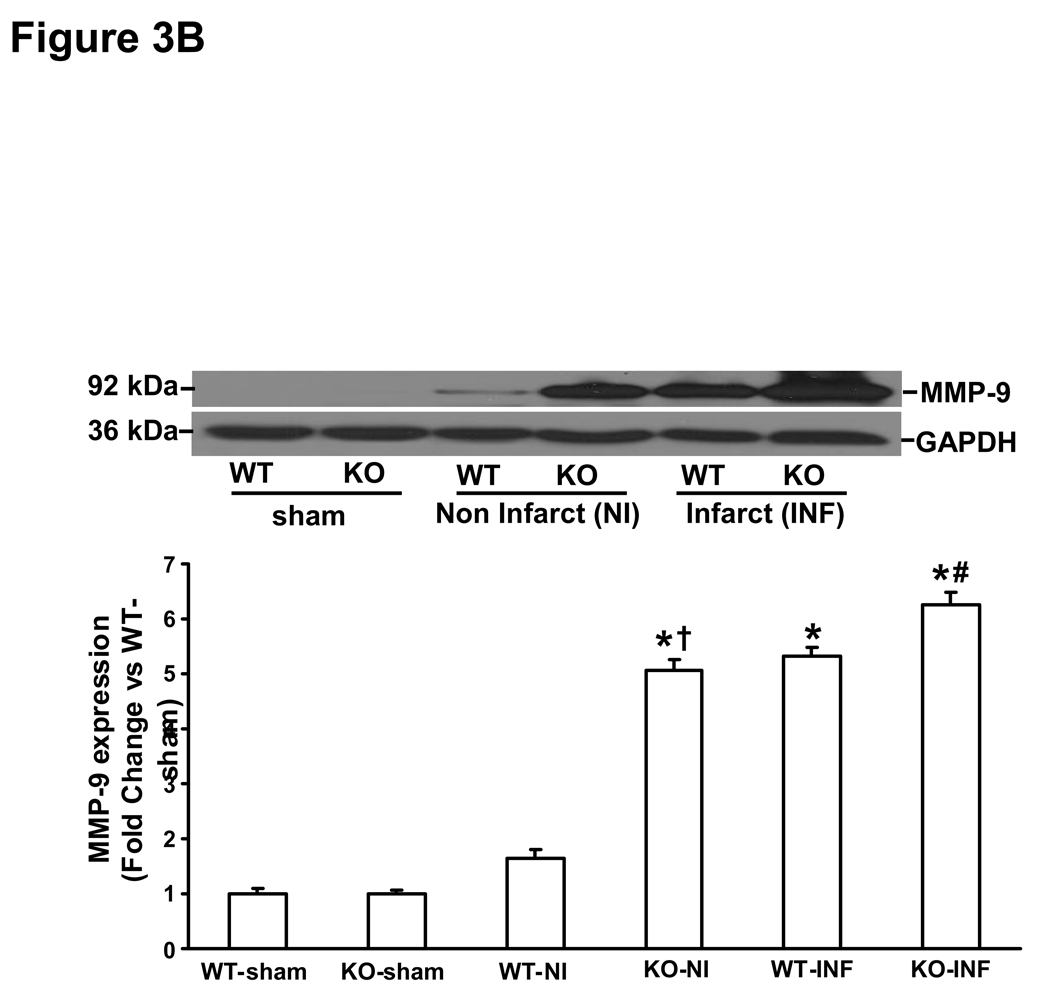
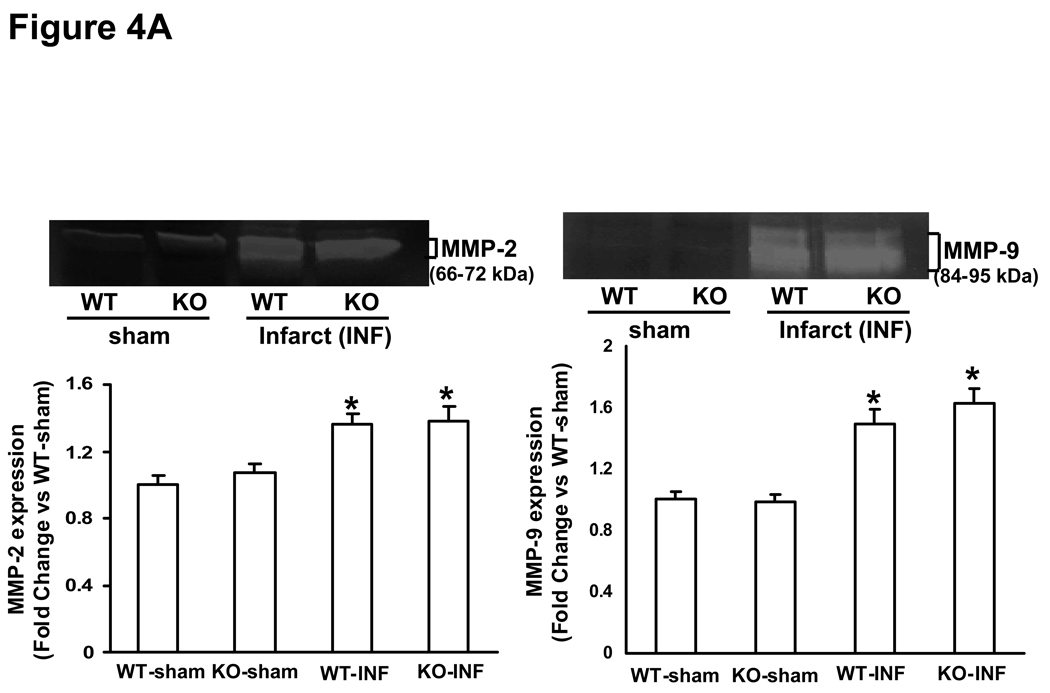
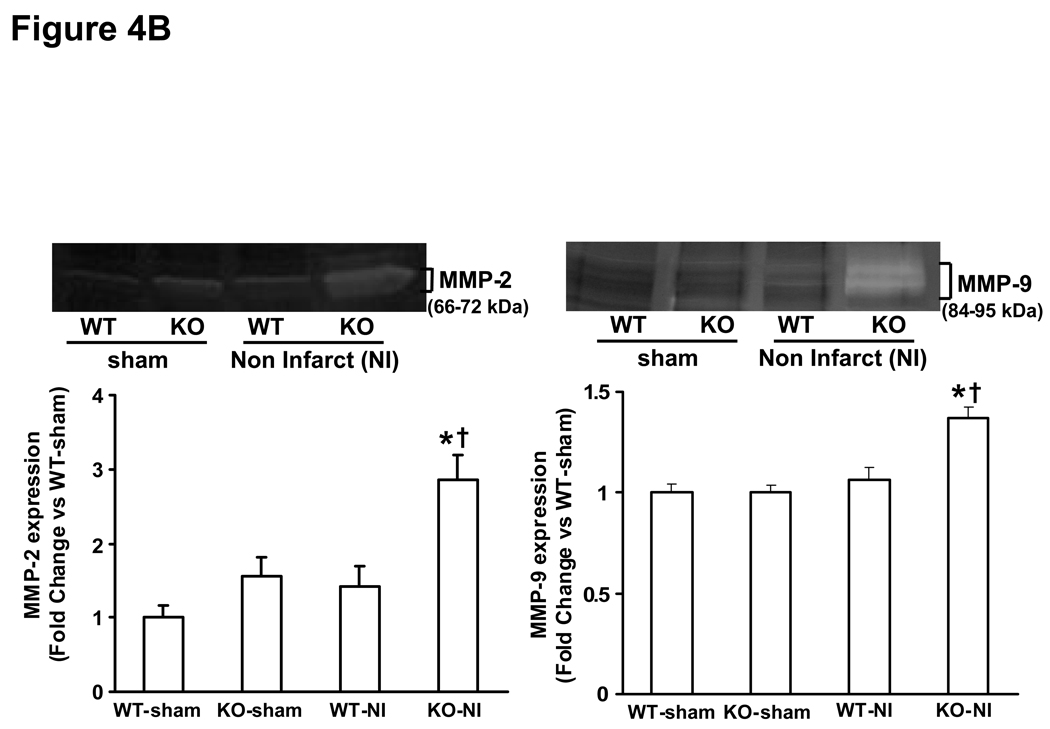
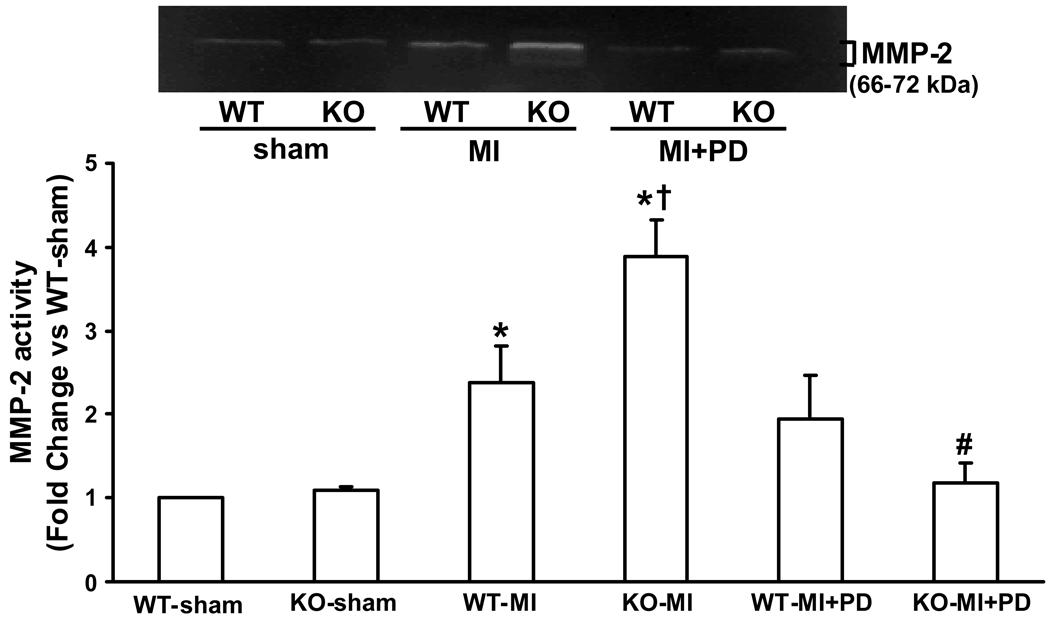
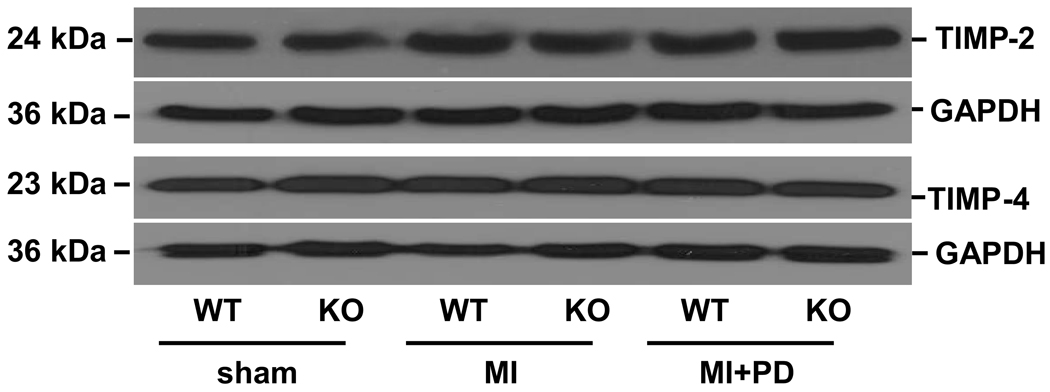
Osteopontin (OPN) plays an important role in left ventricular (LV) remodeling after myocardial infarction (MI) by promoting collagen synthesis and accumulation. This study tested the hypothesis that MMP inhibition modulates post-MI LV remodeling in mice lacking OPN. Wild-type (WT) and OPN knockout (KO) mice were treated daily with MMP inhibitor (PD166793, 30 mg/kg/day) starting 3 days post-MI. LV functional and structural remodeling was measured 14 days post-MI. Infarct size was similar in WT and KO groups with or without MMP inhibition. M-mode echocardiography showed greater increase in LV end-diastolic (LVEDD) and end-systolic diameters (LVESD) and decrease in percent fractional shortening (%FS) and ejection fraction in KO-MI versus WT-MI. MMP inhibition decreased LVEDD and LVESD, and increased %FS in both groups. Interestingly, the effect was more pronounced in KO-MI group versus WT-MI (P < 0.01). MMP inhibition significantly decreased post-MI LV dilation in KO-MI group as measured by Langendorff-perfusion analysis. MMP inhibition improved LV developed pressures in both MI groups. However, the improvement was significantly higher in KO-MI group versus WT-MI (P < 0.05). MMP inhibition increased heart weight-to-body weight ratio, myocyte cross-sectional area, fibrosis and septal wall thickness only in KO-MI. Percent apoptotic myocytes in the non-infarct area was not different between the treatment groups. Expression and activity of MMP-2 and MMP-9 in the non-infarct area was higher in KO-MI group 3 days post-MI. MMP inhibition reduced MMP-2 activity in KO-MI with no effect on the expression of TIMP-2 and TIMP-4 14 days post-MI. Thus, activation of MMPs contributes to reduced fibrosis and LV dysfunction in mice lacking OPN.


Conflict of interest statement

Conflict of Interest/Disclosure: None

Figures

Figure 1
Figure 1
A. Analysis of LV end-diastolic pressure-volume relationships 14 days post-MI. KO-MI group exhibited a rightward shift when compared to WT-MI and sham. *P<0.05 vs. sham; P<0.05 vs. WT-MI; #P<0.05 vs. KO-MI+PD; n=6 except sham groups (n=5). B. Analysis of LV developed pressure versus volume 14 days post-MI. KO-MI group showed significant decrease in the LV developed pressure for a given volume. MMP inhibition increased LVDP at >35 µl volume. *P<0.05 vs. sham; P<0.05 vs. WT-MI; #P<0.05 vs. KO-MI or WT-MI; n=6 except sham groups (n=5).
Figure 2
Figure 2
Quantitative analysis of myocyte cross-sectional area 14 days post-MI. WT-MI showed increased myocyte cross-sectional area as compared to KO-MI and sham groups. MMP inhibition increased myocyte cross-sectional area in KO-MI, not in WT-MI. *P<0.001 vs. WT-sham; P<0.001 vs KO-MI; #P<0.05 vs KO-MI; n=5.
Figure 3
Figure 3
A. MMP-2 protein expression in the left ventricles 3 days post-MI. Total LV lysates were analyzed by Western blot using anti-MMP-2 antibodies. Equal loading of proteins in each lane is indicated by GAPDH immunostaining. The lower panel exhibits the mean data normalized to GAPDH. MMP-2 was higher in non-infarct area, *P<0.05 vs sham; P<0.05 vs WT-NI; n=3. B. MMP-9 protein expression in the left ventricle 3 days post-MI. Total LV lysates were analyzed by Western blot using anti-MMP-9 antibodies. The lower panel exhibits the mean data normalized to GAPDH. MMP-9 was higher in non-infarct area, *P<0.001 KO-INF vs sham; P<0.05 vs WT-INF; n=3. NI, non-infarct area; INF, infarct area.
Figure 3
Figure 3
A. MMP-2 protein expression in the left ventricles 3 days post-MI. Total LV lysates were analyzed by Western blot using anti-MMP-2 antibodies. Equal loading of proteins in each lane is indicated by GAPDH immunostaining. The lower panel exhibits the mean data normalized to GAPDH. MMP-2 was higher in non-infarct area, *P<0.05 vs sham; P<0.05 vs WT-NI; n=3. B. MMP-9 protein expression in the left ventricle 3 days post-MI. Total LV lysates were analyzed by Western blot using anti-MMP-9 antibodies. The lower panel exhibits the mean data normalized to GAPDH. MMP-9 was higher in non-infarct area, *P<0.001 KO-INF vs sham; P<0.05 vs WT-INF; n=3. NI, non-infarct area; INF, infarct area.
Figure 4
Figure 4
A. Gelatin in-gel zymography of infarct area of LV tissue 3 days post-MI. The lower panel exhibits the mean densitometry values for MMP-2 (left) and MMP-9 (right). MMP-2 and MMP-9 was higher in MI groups as compared to sham groups, *P<0.05 vs sham; n=3. B. Gelatin in-gel zymography of non-infarct area of LV tissue 3 days post-MI. The lower panel exhibits the mean densitometry values for MMP-2 (left) and MMP-9 (right). MMP-2 and MMP-9 was higher in KO-NI group as compared to WT-NI and sham groups. MMP-2, *P<0.05 vs sham, P<0.05 vs WT-NI; MMP-9, *P<0.01 vs sham, P<0.05 vs WT-NI; n=3.
Figure 4
Figure 4
A. Gelatin in-gel zymography of infarct area of LV tissue 3 days post-MI. The lower panel exhibits the mean densitometry values for MMP-2 (left) and MMP-9 (right). MMP-2 and MMP-9 was higher in MI groups as compared to sham groups, *P<0.05 vs sham; n=3. B. Gelatin in-gel zymography of non-infarct area of LV tissue 3 days post-MI. The lower panel exhibits the mean densitometry values for MMP-2 (left) and MMP-9 (right). MMP-2 and MMP-9 was higher in KO-NI group as compared to WT-NI and sham groups. MMP-2, *P<0.05 vs sham, P<0.05 vs WT-NI; MMP-9, *P<0.01 vs sham, P<0.05 vs WT-NI; n=3.
Figure 5
Figure 5
Gelatin in-gel zymography of non-infarct area of LV tissue 14 days post-MI. The lower panel exhibits the mean densitometry values for MMP-2. MMP-2 activity was higher in KO-MI group as compared to WT-MI and sham groups. MMP inhibition decreased MMP-2 activity in KO-MI. *P<0.01 vs sham, P<0.05 vs. WT-MI, #P<0.01 vs. KO-MI ; n=4.
Figure 6
Figure 6
TIMP-2 and TIMP-4 protein expression in the non-infarct area of LV tissue 14 days post-MI. Total LV lysates were analyzed by Western blot using anti-TIMP-2 and -4 antibodies. Equal loading of proteins in each lane is indicated by GAPDH immunostaining; n=4.

Similar articles

Cited by

References

    1. Denhardt DT, Noda M, O'Regan AW, Pavlin D, Berman JS. Osteopontin as a means to cope with environmental insults: regulation of inflammation, tissue remodeling, and cell survival. J Clin Invest. 2001;107:1055–1061. - PMC - PubMed
    1. Trueblood NA, Xie Z, Communal C, Sam F, Ngoy S, Liaw L, Jenkins AW, Wang J, Sawyer DB, Bing OH, Apstein CS, Colucci WS, Singh K. Exaggerated left ventricular dilation and reduced collagen deposition after myocardial infarction in mice lacking osteopontin. Circ Res. 2001;88:1080–1087. - PubMed
    1. Xie Z, Singh M, Singh K. Osteopontin modulates myocardial hypertrophy in response to chronic pressure overload in mice. Hypertension. 2004;44:826–831. - PubMed
    1. Ashizawa N, Graf K, Do YS, Nunohiro T, Giachelli CM, Meehan WP, Tuan TL, Hsueh WA. Osteopontin is produced by rat cardiac fibroblasts and mediates A(II)-induced DNA synthesis and collagen gel contraction. J Clin Invest. 1996;98:2218–2227. - PMC - PubMed
    1. Singh K, Sirokman G, Communal C, Robinson KG, Conrad CH, Brooks WW, Bing OH, Colucci WS. Myocardial osteopontin expression coincides with the development of heart failure. Hypertension. 1999;33:663–670. - PubMed

Publication types

Substances