. 2009 Oct;8(5):345-58.
doi: 10.1007/s10237-008-0139-9. Epub 2008 Nov 2.

Spherical indentation of soft matter beyond the Hertzian regime: numerical and experimental validation of hyperelastic models

Affiliations

Spherical indentation of soft matter beyond the Hertzian regime: numerical and experimental validation of hyperelastic models

David C Lin et al. Biomech Model Mechanobiol. 2009 Oct.

Abstract

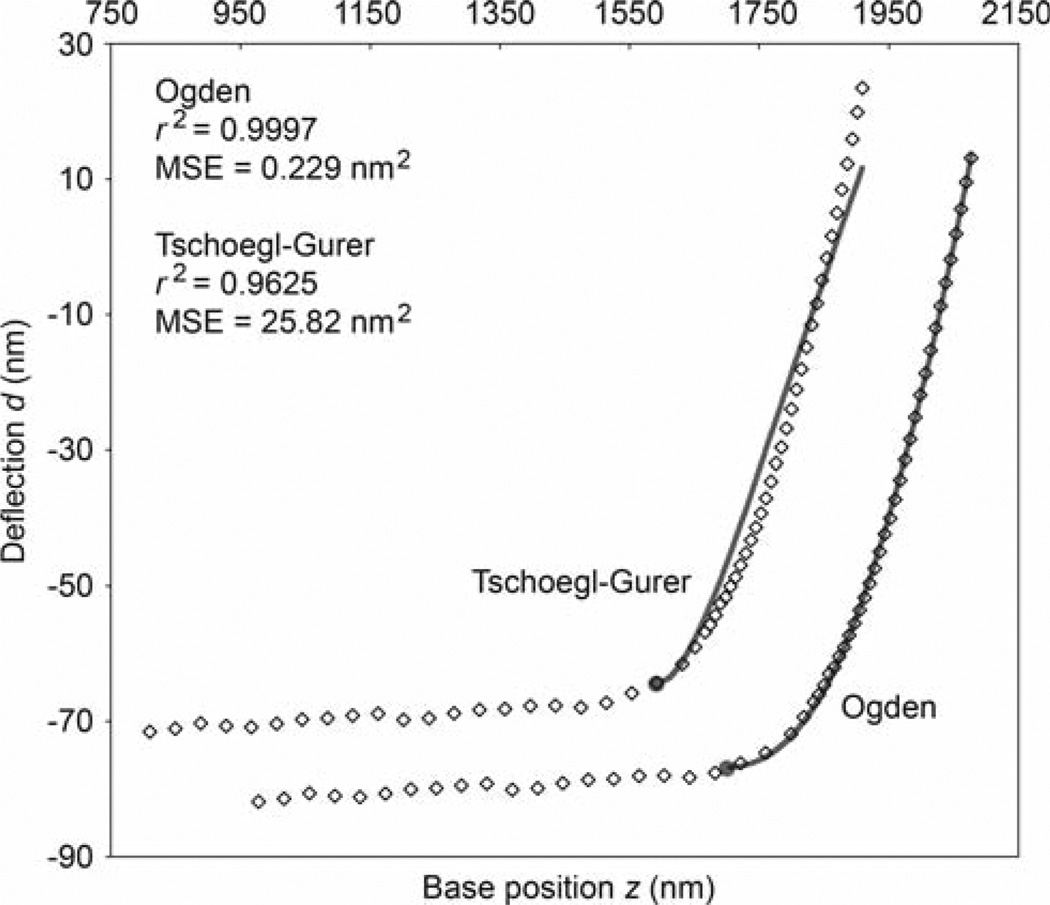
The lack of practicable nonlinear elastic contact models frequently compels the inappropriate use of Hertzian models in analyzing indentation data and likely contributes to inconsistencies associated with the results of biological atomic force microscopy measurements. We derived and validated with the aid of the finite element method force-indentation relations based on a number of hyperelastic strain energy functions. The models were applied to existing data from indentation, using microspheres as indenters, of synthetic rubber-like gels, native mouse cartilage tissue, and engineered cartilage. For the biological tissues, the Fung and single-term Ogden models achieved the best fits of the data while all tested hyperelastic models produced good fits for the synthetic gels. The Hertz model proved to be acceptable for the synthetic gels at small deformations (strain < 0.05 for the samples tested), but not for the biological tissues. Although this finding supports the generally accepted view that many soft materials can be assumed to be linear elastic at small deformations, the nonlinear models facilitate analysis of intrinsically nonlinear tissues and large-strain indentation behavior.


Figures

Fig. 1
Fig. 1
Finite element displacement magnitude map at the maximum displacement of 5 µm. The radius of the sphere is also 5 µm. The gradation of mesh size and the point at which the contact radius is measured are clearly seen
Fig. 2
Fig. 2
FEA results for the Mooney-Rivlin and Ogden hyperelastic materials. a Theoretical equation (2) and FEA-derived, Mooney-Rivlin contact radii as functions of the indentation. Both contact radius and indentation are normalized by the radius of the sphere. The least squares fit of the large displacement FEA data was performed using Eq. (13); the unit of length is nm. Note that since Eq. (13) has three fitting parameters, this solution is not unique. Data for the Ogden case is virtually identical. b Comparison of Eq. (2) and FEA-derived, Mooney-Rivlin contact radii at small displacement. For this case, differences between Mooney-Rivlin, Ogden, and Hertz models were negligible. c Indentation stress–strain curves using the definitions in Eqs. (3). FEA and the theoretical Ogden model from Table 2 both indicate significant nonlinearity. d Vertical strain field in the Ogden material at maximum indentation (δ = R). The maximum compressive strain of ~46% occurs at the point of initial contact, but the average value is in line with the definition ε* = 0.2a/R
Fig. 3
Fig. 3
Sample compressive engineering stress–strain behavior of a PVA gel cylinder. Every tenth data point is plotted. Compressive stresses and strains are taken to be positive for consistency with the convention used in indentation. The solid curve is the best fit (r2 = 0.9999) to the data using the uniaxial Mooney-Rivlin equation (see Table 1). The analysis was limited to the deformation range 0 < ε < 0.3. For this particular case, E0 = 20.69 kPa and the fitting parameters are C1 = 3.214 kPa and C2 = 0.235 kPa. The quality of fit is virtually indistinguishable among the various hyperelastic models
Fig. 4
Fig. 4
Sample deflection-position data showing every tenth data point from the AFM indentation of the extracellular matrix of mouse cartilage. The data is plotted twice, with the two sets shifted apart for clarity. The solid curves are the best fits using the Fung (fitting parameters B = 19.59 kPa and b = 196.5, E0 = 20.78 kPa) and Mooney-Rivlin (fitting parameters B1 = 2.289 × 10⁻⁵ kPa and B2 = 149.35 kPa, E0 = 158.36 kPa) force-indentation equations (see Table 2). The points of contact are indicated by the filled circles. Also shown are the coefficient of determination and mean-squared-error (MSE) for each fit. These values are also listed for the fit using the older form of the Mooney-Rivlin equation given by Eq. (5)
Fig. 5
Fig. 5
Sample deflection-position data showing every tenth data point from the AFM indentation of a mouse cartilage chondrocyte. The data is plotted twice, with the two sets shifted apart for clarity. The solid curves are the best fits using the Ogden (fitting parameters B = 25.41 kPa and α = 115.4, E0 = 13.47 kPa) and Tschoegl-Gurer (fitting parameters B1 = 6.804 × 10⁻⁶ kPa and B2 = 430.8 kPa, E0 = 77.65 kPa) force-indentation equations (see Table 2). The points of contact are indicated by the filled circles. Also shown are the coefficient of determination and mean-squared-error (MSE) for each fit
Fig. 6
Fig. 6
Young’s modulus map and surface plot of a 30 × 30 µm region of mouse cartilage. Moduli were computed using the Fung model. Mean coefficient of determination of the 1,024 fits: 0.999
Fig. 7
Fig. 7
Indentation stress versus strain (0.2 a/R) for representative microindentations of the PVA gel, mouse cartilage extracellular matrix, and chondrocytes. Data are from the Fung fit of sample AFM datasets (PVA E0 = 19.1 kPa, matrix E0 = 20.7 kPa, chondrocyte E0 = 12.2 kPa). The stress–strain response of the PVA gel appears linear (due to the scaling, nonlinearity is not obvious) while the cartilage components are highly nonlinear. Inset shows the relationship up to 2% strain

References

    1. Aklonis JJ, MacKnight WJ. Introduction to polymer viscoelasticity. New York: Wiley; 1983.
    1. Arruda EM, Boyce MC. A three-dimensional constitutive model for the large deformation stretch behavior of rubber elastic materials. J Mech Phys Solids. 1993;41:389–412.
    1. Bilston LE, Thibault LE. Themechanical properties of the human cervical spinal cord in vitro. Ann Biomed Eng. 1996;24:67–74. - PubMed
    1. Blatz PJ, Sharda SC, Tschoegl NW. Strain energy function for rubberlike materials based on a generalized measure of strain. J Rheol (NYNY) 1974;18:145–161.
    1. Briscoe BJ, Fiori L, Pelillo E. Nano-indentation of polymeric surfaces. J Phys D. 1998;31:2395–2405.

Publication types

LinkOut - more resources