. 2009 Feb;10(2):218-34.
doi: 10.1111/j.1600-0854.2008.00853.x. Epub 2008 Oct 31.

Alpha-synuclein and polyunsaturated fatty acids promote clathrin-mediated endocytosis and synaptic vesicle recycling

Affiliations

Alpha-synuclein and polyunsaturated fatty acids promote clathrin-mediated endocytosis and synaptic vesicle recycling

Tziona Ben Gedalya et al. Traffic. 2009 Feb.

Abstract

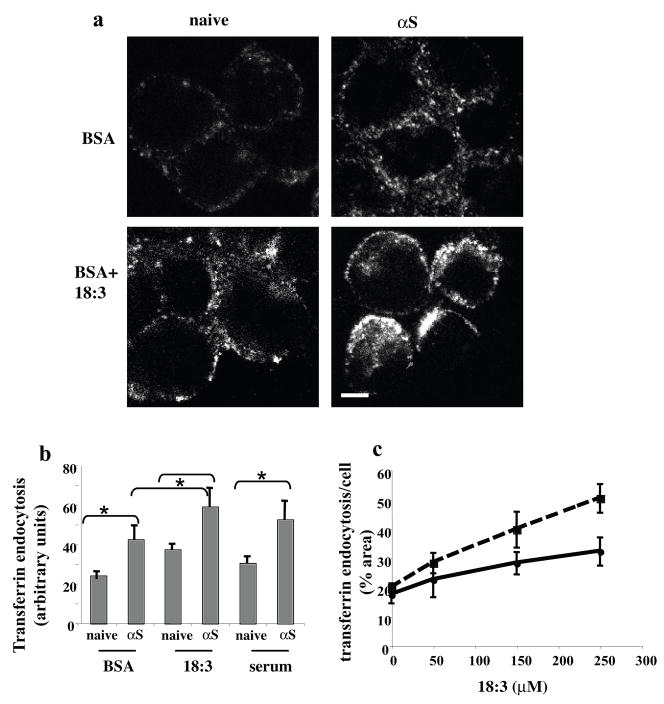
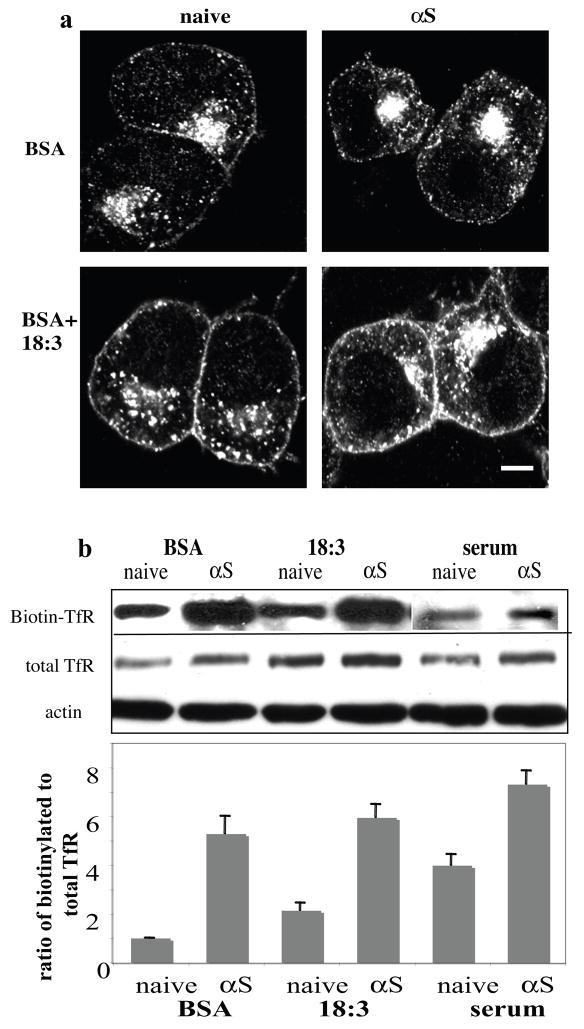
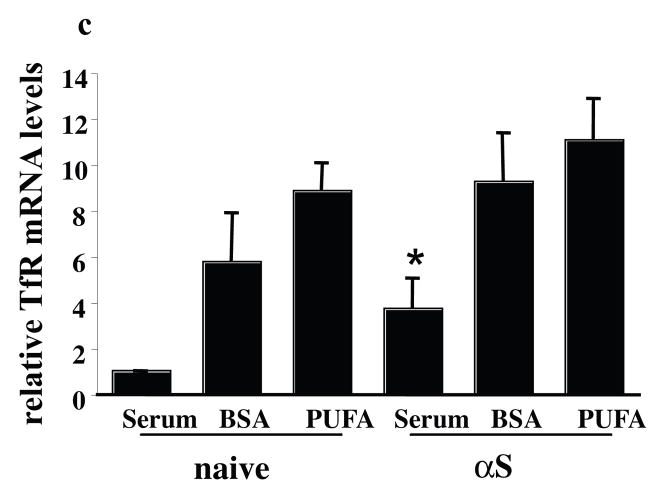
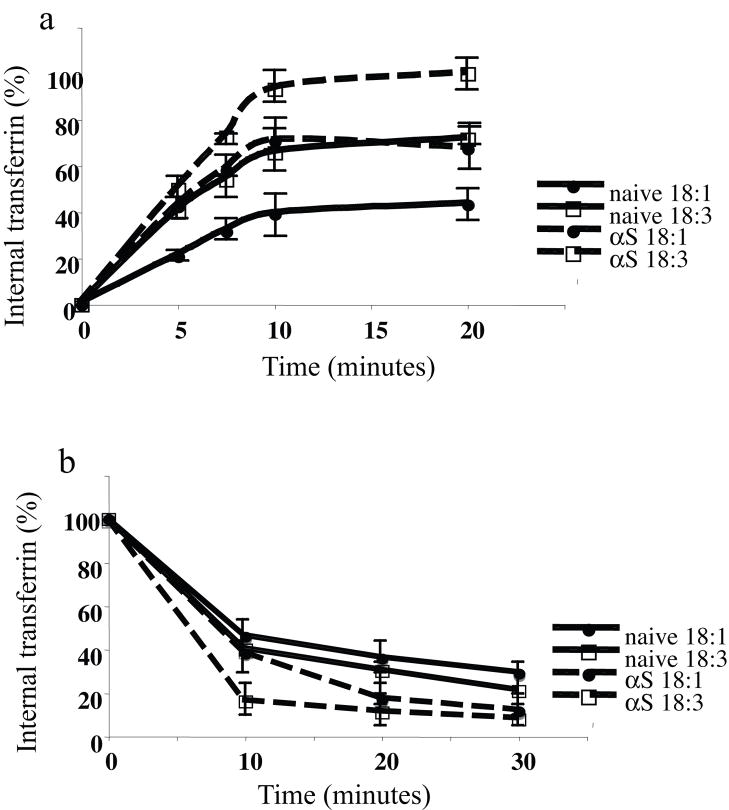
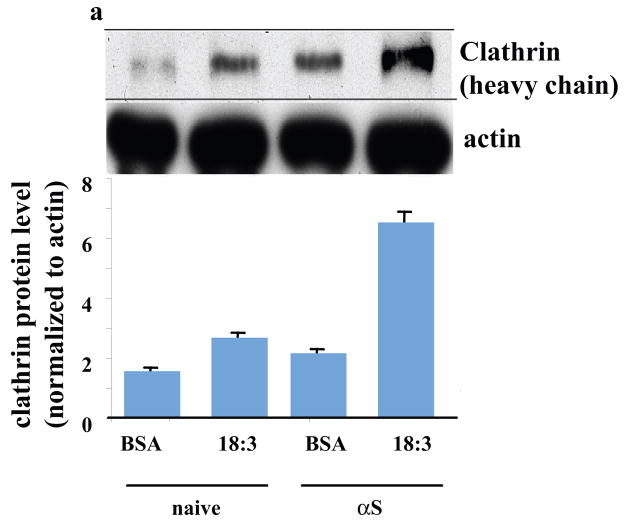
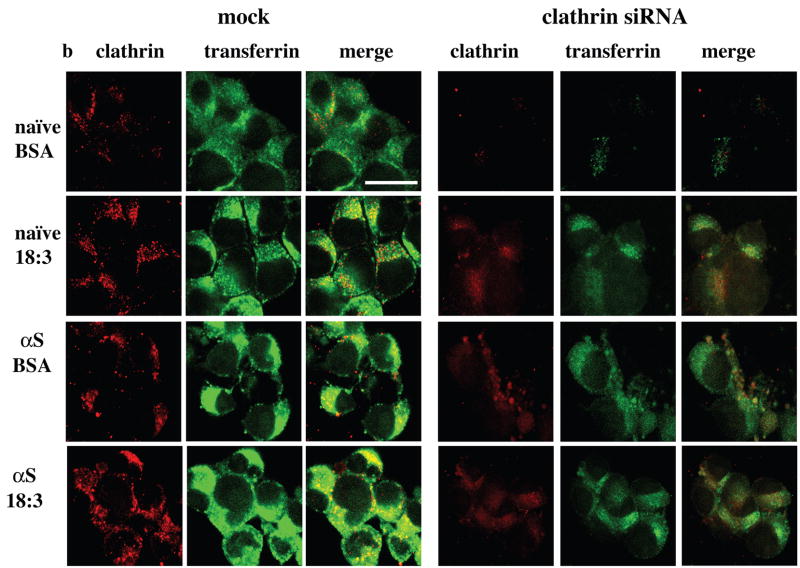
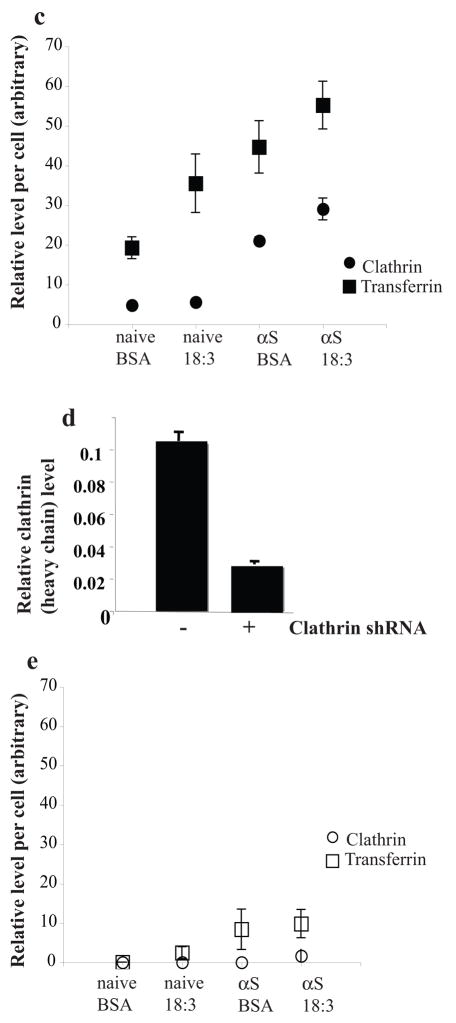
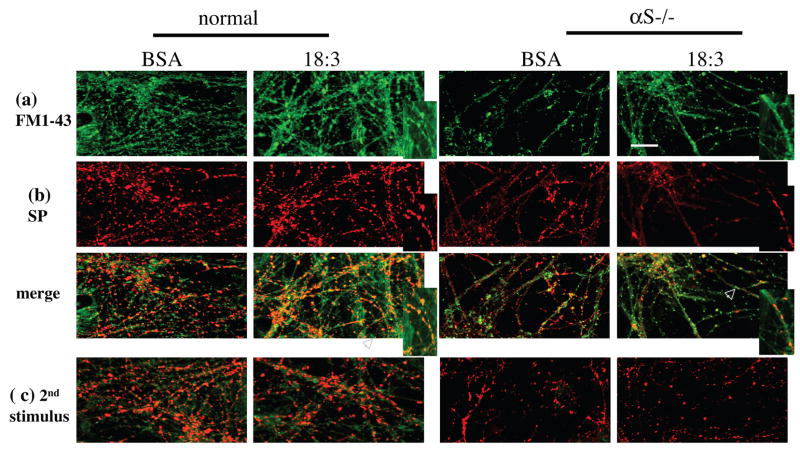
Alpha-synuclein (alphaS) is an abundant neuronal cytoplasmic protein implicated in Parkinson's disease (PD), but its physiological function remains unknown. Consistent with its having structural motifs shared with class A1 apolipoproteins, alphaS can reversibly associate with membranes and help regulate membrane fatty acid composition. We previously observed that variations in alphaS expression level in dopaminergic cultured cells or brains are associated with changes in polyunsaturated fatty acid (PUFA) levels and altered membrane fluidity. We now report that alphaS acts with PUFAs to enhance the internalization of the membrane-binding dye, FM 1-43. Specifically, alphaS expression coupled with exposure to physiological levels of certain PUFAs enhanced clathrin-mediated endocytosis in neuronal and non-neuronal cultured cells. Moreover, alphaS expression and PUFA-enhanced basal and -evoked synaptic vesicle (SV) endocytosis in primary hippocampal cultures of wild type (wt) and genetically depleted alphaS mouse brains. We suggest that alphaS and PUFAs normally function in endocytic mechanisms and are specifically involved in SV recycling upon neuronal stimulation.


Figures

Figure 1
Figure 1. αS occurs in soluble oligomers in vivo and promote incorporation of 14C OA
(a) Samples of post 100,000g cytosols (15μg) of brains from wt (16 month), αS +/+ (9 month) and αS −/− (15 month) mice were incubated with Lipidex-1000 at 4 °C for 16 hours followed by native gel electrophoresis (10% Tris-Glycine) and western blotting with syn-1 antibody. (b) Samples of post 100,000g cytosols (15 μg) from naive or αS-overexpressing MES cells conditioned with 14C OA (35 μM) for 16 hours and subjected to native gel electrophoresis (autoradiogram).
Figure 2
Figure 2. FM1-43 internalization into MES 23.5 dopaminergic cells is induced by αS over expression and 18:3 PUFA
(a). Naive, wt and A53T αS over expressing MES cells conditioned in standard serum-containing medium and labeled with 2.5 μM FM1-43 fluorescent dye (molecular probes Eugene, OR) for 4 minutes. Access of dye was removed, and 10 minutes later the cells were fixed and tested for intracellular FM1-43 fluorescence. Pictures were taken in confocal, laser scanning microscope (Zeiss LSM 410) under non-saturating conditions. (b). Naïve, wt and A53T αS over expressing MES cells were conditioned for 16–18 hours in serum-free medium supplemented with 50μM BSA, followed by labeling with FM1-43 as in (a). (c). Cells as in (b) but conditioned in serum free medium supplemented with BSA only (50 μM) plus 250 μM 18:3 PUFA. (d). Quantitative presentation of the intracellular FM1-43 in BSA vs. PUFA treated cultures. Quantitation was performed on the captured images at selected image plane with the greatest intracellular FM1-43 signal, using ImageJ software, measuring the average fluorescence intensity (above threshold) across the entire cell divided by the area of the tested cell. Mean of 10–15 cells ± SD. * significant over the corresponding treatment in naïve cells and ** significant over the corresponding treatment in wt αS over expressing cells. TTEST P value < 0.05 (e) Cells were treated as in (b) and (c) but with 20 μM BSA with or without 100 μM 18:3 respectively. (f) Western blot of cytosolic extract from naïve, wt and A53T over expressing cells, treated for oligomers detection (49) and probed with anti αS H3C ab. Bar represents 10 μm.
Figure 3
Figure 3. FM1-43 endocytosis as a function of fatty acid length and saturation
αS over expressing MES dopaminergic cells were grown on 12-wells cover glass and conditioned for 16 hours in serum free medium supplemented with BSA only (50 μM) or with 250 μM of the indicated FA in sister cultures, in parallel. Cells were then labeled with FM1-43 as in Fig 2a and fixed. Representative pictures are presented. Image acquisition by Zeiss LSM 410. Acquisition parameters were kept fixed throughout. Bar represents 10 μm.
Figure 4
Figure 4. αS and PUFA act to induce endocytosis of Tf
(a) Naïve and wt αS over expressing MN9D cells were grown on 12-wells cover glass and conditioned for 18 hours in DMEM containing 250 μM 18:3 PUFA or DMEM with BSA (50 μM). Alexa-488 human Tf (molecular probes, Eugene, Or) (50μg/ml) were then added to the cells in plain DMEM medium (without serum, antibiotics or nutrients) in cold, to allow binding of Tf to the TfR. After the removal of unbound Tf, cells were incubated for 10 minutes at 37° in serum free medium supplemented with BSA or PUFA accordingly. Cells were then fixed and observed by Olympus FluoView FV300 confocal microscope. (b) Quantitation of Alexa-488 Tf endocytosis. Cells and treatments as in (a) plus naïve and αS over expressing MN9D conditioned in standard serum-supplemented medium. All images were taken at the same settings and the image plane containing maximal intracellular signal was selected. Threshold was set as to measure only endocytic vesicles, rather then including a more diffuse background. All measurements were of “selected region of interest” normalized to cell area. Mean of n=10 cells of each treatment ± SD. *, ttest p<0.01. (c) the endocytosis of Alexa-488-Tf is PUFA- dose dependent in naïve and αS over expressing cells. αS over expressing SK-N-SH cells were grown as in (a), conditioned with the indicated 18:3 concentration and quantified as in (b). Graph presenting the sum of signal in endocytic vesicles (above threshold) to 18:3 concentrations. n=10 cells counted ± SD of αS over expressing cells (Dashed line) and naive (filled line). Bar represents 10 μm.
Figure 5
Figure 5. αS and PUFA affect TfR levels and cellular distribution
(a) Naïve and human wt αS over expressing MN9D neuronal cells were grown on 12-wells cover glass, conditioned for 18 hours in 250 μM 18:3 PUFA or in BSA only (50 μM). Tf (50μM) was added as in fig. 4a and cells were processed for icc using anti TfR ab (Zymed Laboratories CA, USA). (b) αS and PUFA increase levels of cell surface TfR. Biotinylation of cell surface TfR, normalized to total TfR using anti TfR ab (Zymed Laboratories CA, USA) and to actin (Sigma Rehovot Israel), and its densiometric analysis. (c) αS and PUFA induce TfR expression levels. Quantitative Real Time PCR reaction of total RNA extracted from naïve and αS over expressing MN9D cells treated in BSA +/− 18:3 (at 50 and 250 μM for BSA and 18:3). The levels of TfR mRNA was normalized to the 18S mRNA. Mean of three experiments ± SE. Bar represents 10 μm.
Figure 6
Figure 6. αS and PUFA activate the rate of membrane trafficking
Naïve and wt αS over expressing MN9D cells were conditioned for 16–18 hours in serum-free medium supplemented with BSA+/− 18:3 PUFA (50 and 250 μM for BSA and PUFA respectively). TfRs were loaded with Alexa 488 Tf. Recycling of Tf was measured by FACS analyses (see methods). Graphs present the mean and SD of three experiments. (a) internalization, results are presented as percent of the sample with maximal internalized transferrin in each test. (b) recycling, results are presented as the loss (percent) of cell associated fluorescence for each treatment.
Figure 7
Figure 7. αS and PUFA -induced Tf endocytosis is clathrin dependent
Naïve and wt αS over expressing MES cells were conditioned for 16–18 hours in serum-free medium supplemented with BSA+/− 18:3 PUFA (50 and 250 μM for BSA and PUFA respectively). Whole cell extract was analyzed by western blot and probed with clathrin (heavy chain) antibody. Results are normalized to actin and presented in arbitrary units. (b) Naïve and wt αS over expressing MN9D cells were grown on 12-wells cover glass and transfected with either mock (empty Plko.1 plasmid) - or shRNA for clathrin heavy chain. Thirty two hours post DNA transfection the cells were transferred to serum-free conditioning medium, supplemented with BSA+18:3 PUFA (50 and 250 μM for BSA and FA respectively) for 16 hr. 48 hr post DNA-transfection, 50μg/ml Alexa-488 human Tf were added to the cells (as in Fig 4a). Cells were fixed and processed for detection of Alexa 488-Tf and icc with anti clathrin antibody (see methods). (c) Quantitation of Alexa-488 Tf endocytosis and clathrin protein levels. Cells and treatments as in (b), images were taken at the same settings and the image plane containing maximal intracellular signal was selected. Threshold was set as to measure only endocytic vesicles, rather then including a more diffuse background. All measurements were of “selected region of interest” normalized to cell area. Mean of n=10 cells of each treatment ± SD. ANOVA p<0.001. (d) Clathrin (heavy chain) protein levels in αS over expressing MES cells transfected with plko.1 or clathrin shRNA and treated with PUFA as in (b). Deniomentic analyses of western blot probed with anti clathrin antibody and normalized to tubulin signal on the same blot. (e) Quantitation of Alexa-488 Tf endocytosis and clathrin protein levels in MES cells transfected with clathrin siRNA (b). Images as in (c). Bar represents 10 μm.
Fig. 8
Fig. 8. Reduced FM1-43 internalization into synaptic vesicles and reduced synaptic pool in αS −/− primary hippocampal neurons
Hippocampal primary cultures (at 18 days) of normal and αS −/− mouse brains were conditioned for 16 hours in serum-free medium supplemented with BSA +/− 50 μM 18:3. (a) αS expression and PUFA treatment activate SV endocytosis. Fluorescence image after exposure to 10 μM FM1-43 in 90 mM K+ solution for 60 s, followed by washout. White arrow represents the area of the inset. Bar represents 50 μM. (b) icc with anti synaptophysin ab (DAKO) performed on slides from (a). (c) Fluorescence image of cultures treated as in (a), after a second stimulation with 70 mM K+ (FM1-43 download). (d) αS expression and PUFA treatment induced constitutive internalization of FM1-43 into neuronal cell bodies. Bar represents 25 μM. Fluorescent images as in (a and b) but without chemical stimulation.

References

    1. Ibanez P, Bonnet AM, Debarges B, Lohmann E, Tison F, Pollak P, Agid Y, Durr A, Brice A. Causal relation between alpha-synuclein gene duplication and familial Parkinson’s disease. Lancet. 2004;364(9440):1169–1171. - PubMed
    1. Singleton AB, Farrer M, Johnson J, Singleton A, Hague S, Kachergus J, Hulihan M, Peuralinna T, Dutra A, Nussbaum R, Lincoln S, Crawley A, Hanson M, Maraganore D, Adler C, et al. alpha-Synuclein locus triplication causes Parkinson’s disease. Science. 2003;302(5646):841. - PubMed
    1. Baba M, Nakajo S, Tu PH, Tomita T, Nakaya K, Lee VM, Trojanowski JQ, Iwatsubo T. Aggregation of alpha-synuclein in Lewy bodies of sporadic Parkinson’s disease and dementia with Lewy bodies. Am J Pathol. 1998;152(4):879–884. - PMC - PubMed
    1. Spillantini MG, Schmidt ML, Lee VM, Trojanowski JQ, Jakes R, Goedert M. Alpha-synuclein in Lewy bodies. Nature. 1997;388(6645):839–840. - PubMed
    1. Choi W, Zibaee S, Jakes R, Serpell LC, Davletov B, Crowther RA, Goedert M. Mutation E46K increases phospholipid binding and assembly into filaments of human alpha-synuclein. FEBS Lett. 2004;576(3):363–368. - PubMed

Publication types

MeSH terms