

Transgenic mice expressing dominant-negative bright exhibit defects in B1 B cells
- PMID: 18981111
- PMCID: PMC2636627
- DOI: 10.4049/jimmunol.181.10.6913
Transgenic mice expressing dominant-negative bright exhibit defects in B1 B cells
Abstract
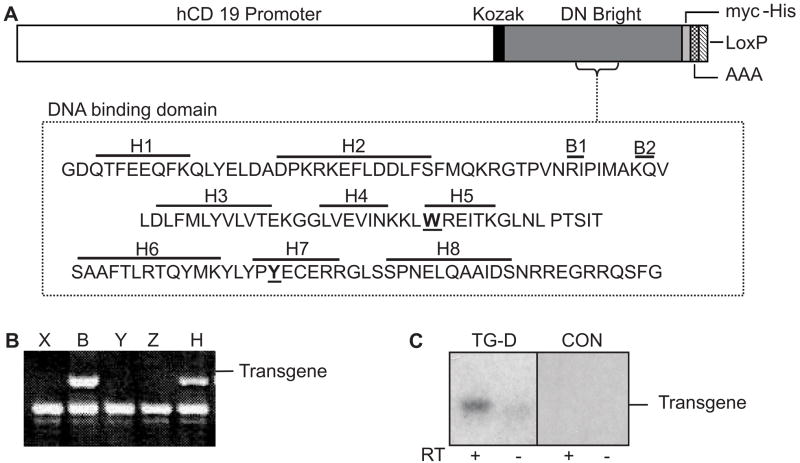
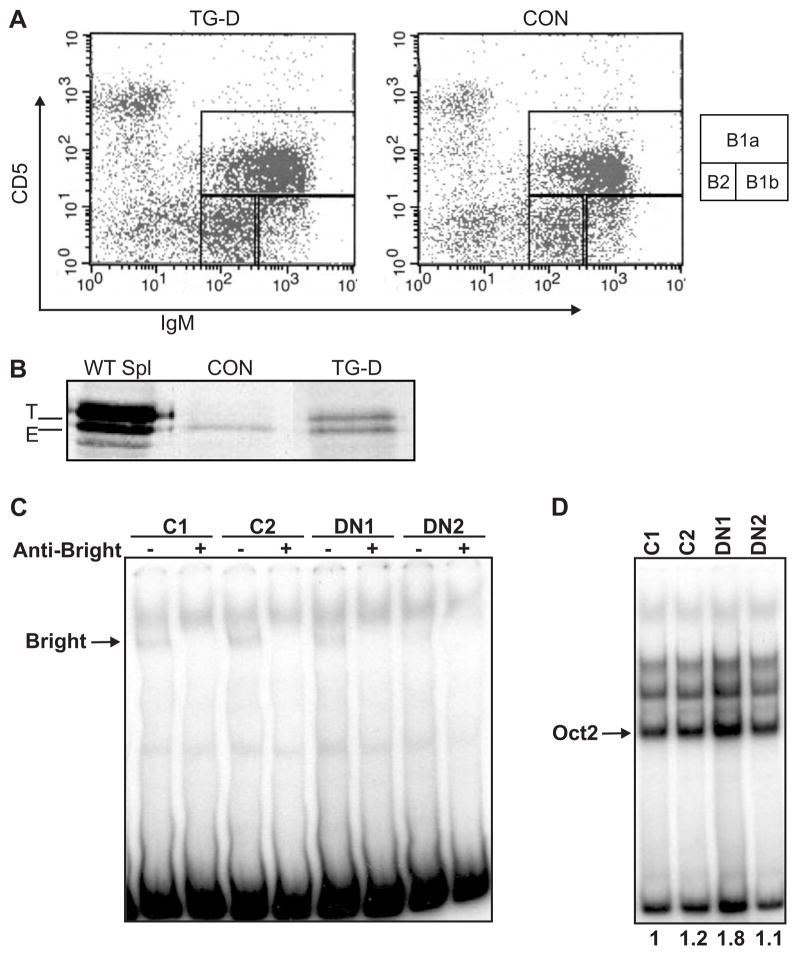
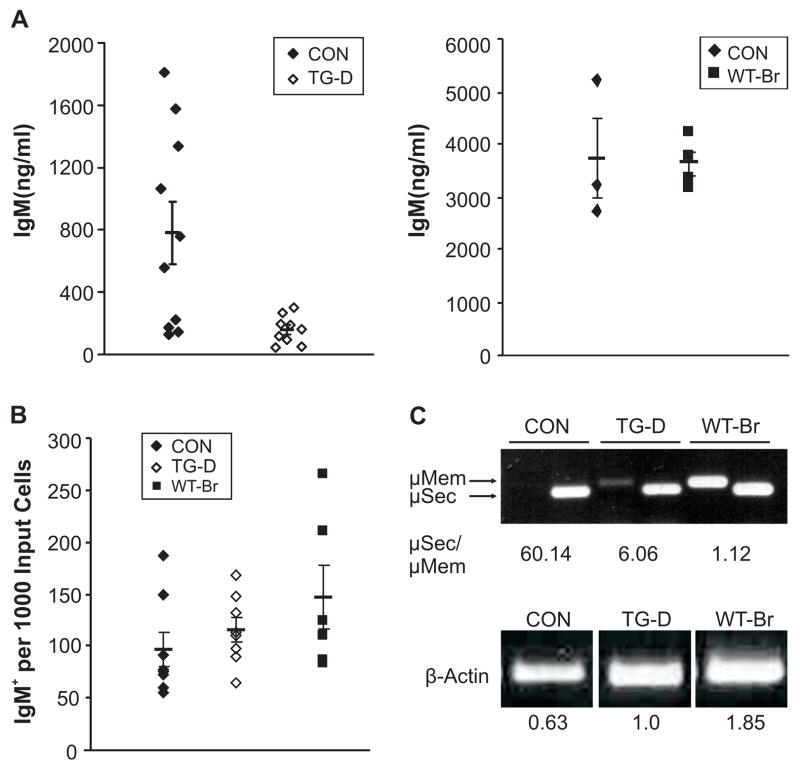
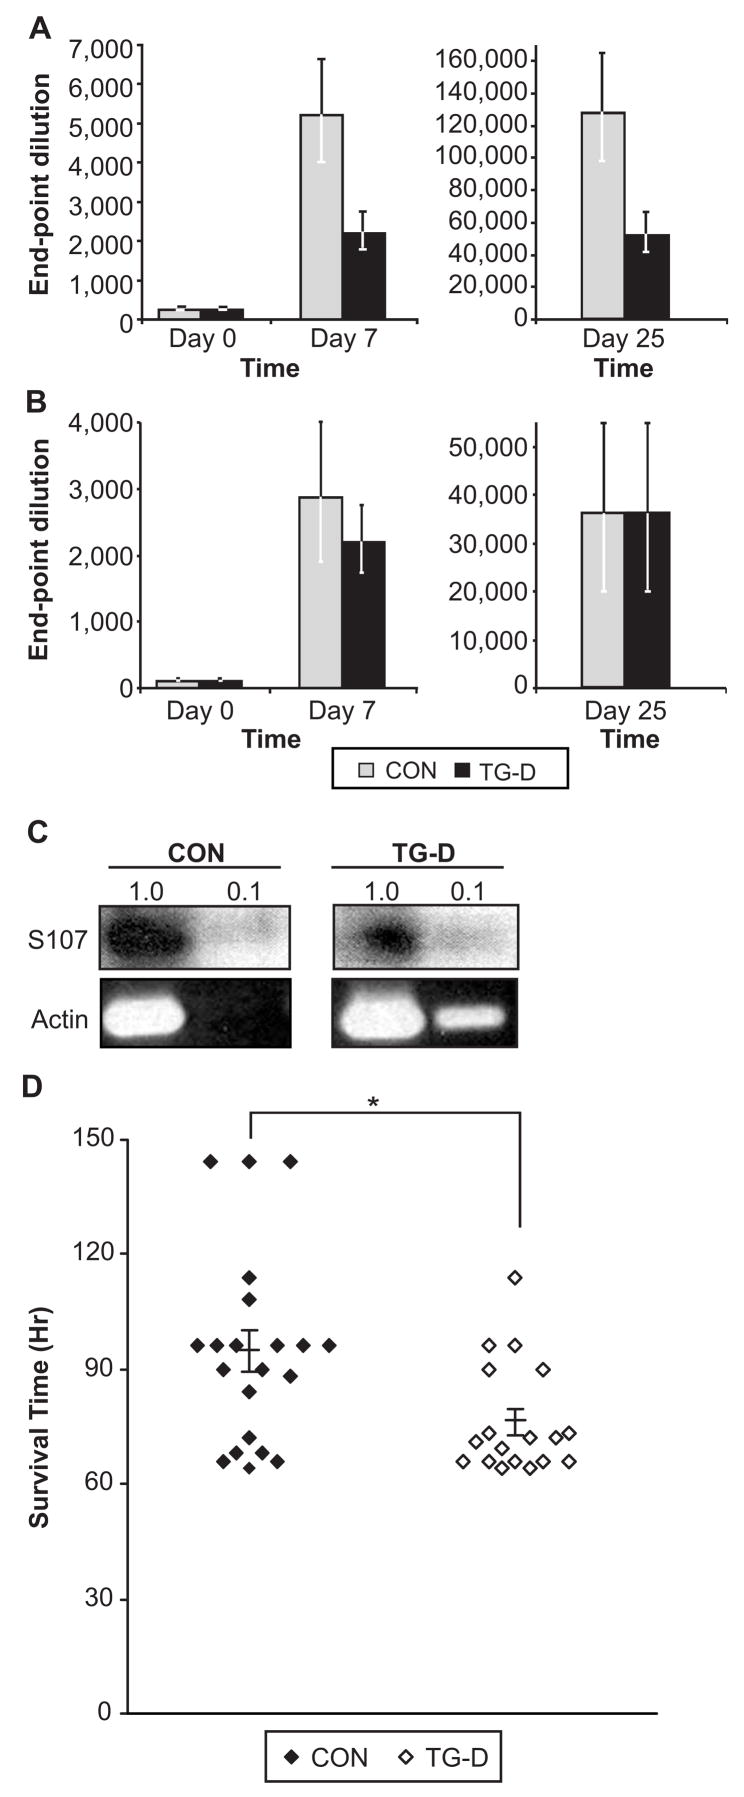
The transcription factor Bright up-regulates Ig H chain production from select V region promoters and requires Bright dimerization, Bruton's tyrosine kinase (Btk), and the Btk substrate, TFII-I, for this activity. Defects in Btk cause X-linked immunodeficiency disease in mice and humans. Btk-deficient mice exhibit decreased serum IgM production, B cell developmental blocks, absence of peritoneal B1 cells, and subnormal immune responses against Ags, including phosphorylcholine, which confer protection against Streptococcus pneumoniae. Transgenic mice expressing dominant-negative Bright share similarities with Btk-deficient mice, including decreased serum IgM, poor anti-phosphorylcholine responses, and slightly reduced numbers of mature B cells. Although dominant-negative Bright mice developed B1 B cells, these were functionally deficient in Ig secretion. These data suggest a mechanistic explanation for the abnormal responses to phosphorylcholine observed in Btk-deficient mice, and indicate that Bright functions in a subset of Btk-dependent pathways in vivo, particularly those responses dominated by B1 B cells.
Figures


Similar articles
-
Bruton's tyrosine kinase regulates immunoglobulin promoter activation in association with the transcription factor Bright.Mol Cell Biol. 2005 Mar;25(6):2073-84. doi: 10.1128/MCB.25.6.2073-2084.2005. Mol Cell Biol. 2005. PMID: 15743806 Free PMC article.
-
Induction of immunoglobulin heavy-chain transcription through the transcription factor Bright requires TFII-I.Mol Cell Biol. 2006 Jun;26(12):4758-68. doi: 10.1128/MCB.02009-05. Mol Cell Biol. 2006. PMID: 16738337 Free PMC article.
-
The transcription factor Bright associates with Bruton's tyrosine kinase, the defective protein in immunodeficiency disease.J Immunol. 2000 Dec 15;165(12):6956-65. doi: 10.4049/jimmunol.165.12.6956. J Immunol. 2000. PMID: 11120822
-
Role of Bruton's tyrosine kinase in B cell development.Dev Immunol. 2001;8(3-4):171-81. doi: 10.1155/2001/28962. Dev Immunol. 2001. PMID: 11785667 Free PMC article. Review.
-
Functions of Bruton's tyrosine kinase in mast and B cells.J Leukoc Biol. 1999 Mar;65(3):286-90. doi: 10.1002/jlb.65.3.286. J Leukoc Biol. 1999. PMID: 10080529 Review.
Cited by
-
Loss of Bright/ARID3a function promotes developmental plasticity.Stem Cells. 2010 Sep;28(9):1560-7. doi: 10.1002/stem.491. Stem Cells. 2010. PMID: 20680960 Free PMC article.
-
Transgenic expression of survivin compensates for OX40-deficiency in driving Th2 development and allergic inflammation.Eur J Immunol. 2013 Jul;43(7):1914-24. doi: 10.1002/eji.201243081. Epub 2013 May 28. Eur J Immunol. 2013. PMID: 23616302 Free PMC article.
-
CCL5-independent helper T lymphocyte responses to immuno-dominant pneumococcal surface protein A epitopes.Vaccine. 2012 Feb 1;30(6):1181-90. doi: 10.1016/j.vaccine.2011.12.020. Epub 2011 Dec 14. Vaccine. 2012. PMID: 22178100 Free PMC article.
-
Disease activity in systemic lupus erythematosus correlates with expression of the transcription factor AT-rich-interactive domain 3A.Arthritis Rheumatol. 2014 Dec;66(12):3404-12. doi: 10.1002/art.38857. Arthritis Rheumatol. 2014. PMID: 25185498 Free PMC article.
-
ARID3a expression in human hematopoietic stem cells is associated with distinct gene patterns in aged individuals.Immun Ageing. 2020 Sep 3;17:24. doi: 10.1186/s12979-020-00198-6. eCollection 2020. Immun Ageing. 2020. PMID: 32905435 Free PMC article.
References
-
- Webb CF, Das C, Coffman RL, Tucker PW. Induction of immunoglobulin μ mRNA in a B cell transfectant stimulated with interleukin-5 and a T-dependent antigen. J Immunol. 1989;143:3934–3939. - PubMed
-
- Herrscher RF, Kaplan MH, Lelsz DL, Das C, Scheuermann R, Tucker PW. The immunoglobulin heavy-chain matrix-associating regions are bound by Bright: a B cell-specific trans-activator that describes a new DNA-binding protein family. Genes Dev. 1995;9:3067–3082. - PubMed
-
- Wilsker D, Patsialou A, Dallas PB, Moran E. ARID proteins: a diverse family of DNA binding proteins implicated in the control of cell growth, differentiation, and development. Cell Growth Differ. 2002;13:95–106. - PubMed
-
- Kortschak RD, Tucker PW, Saint R. ARID proteins come in from the desert. Trends Biochem Sci. 2000;25:294–299. - PubMed
Publication types
MeSH terms
Substances
Grants and funding
LinkOut - more resources
Full Text Sources
Other Literature Sources
Molecular Biology Databases
