. 2008 Nov 15;181(10):7390-9.
doi: 10.4049/jimmunol.181.10.7390.

Intestinal macrophage/epithelial cell-derived CCL11/eotaxin-1 mediates eosinophil recruitment and function in pediatric ulcerative colitis

Affiliations

Intestinal macrophage/epithelial cell-derived CCL11/eotaxin-1 mediates eosinophil recruitment and function in pediatric ulcerative colitis

Richard Ahrens et al. J Immunol. .

Abstract

Clinical studies have demonstrated a link between the eosinophil-selective chemokines, eotaxins (eotaxin-1/CCL11 and eotaxin-2/CCL24), eosinophils, and the inflammatory bowel diseases, Crohn's disease and ulcerative colitis (UC). However, the cellular source and individual contribution of the eotaxins to colonic eosinophilic accumulation in inflammatory bowel diseases remain unclear. In this study we demonstrate, by gene array and quantitative PCR, elevated levels of eotaxin-1 mRNA in the rectosigmoid colon of pediatric UC patients. We show that elevated levels of eotaxin-1 mRNA positively correlated with rectosigmoid eosinophil numbers. Further, colonic eosinophils appeared to be degranulating, and the levels positively correlated with disease severity. Using the dextran sodium sulfate (DSS)-induced intestinal epithelial injury model, we show that DSS treatment of mice strongly induced colonic eotaxin-1 and eotaxin-2 expression and eosinophil levels. Analysis of eosinophil-deficient mice defined an effector role for eosinophils in disease pathology. DSS treatment of eotaxin-2(-/-) and eotaxin-1/2(-/-) mice demonstrated that eosinophil recruitment was dependent on eotaxin-1. In situ and immunofluorescence analysis-identified eotaxin-1 expression was restricted to intestinal F4/80(+)CD11b(+) macrophages in DSS-induced epithelial injury and to CD68(+) intestinal macrophages and the basolateral compartment of intestinal epithelial cells in pediatric UC. These data demonstrate that intestinal macrophage and epithelial cell-derived eotaxin-1 plays a critical role in the regulation of eosinophil recruitment in colonic eosinophilic disease such as pediatric UC and provides a basis for targeting the eosinophil/eotaxin-1 axis in UC.


Conflict of interest statement

Disclosures

The authors have no financial conflict of interest.

Figures
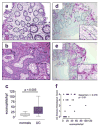
FIGURE 1
FIGURE 1
Eosinophil levels and degranulation in pediatric UC. a and b, Representative H&E-stained rectosigmoid colonic biopsy samples from normal patients (normals) (a) and pediatric UC (b) patients. c, Eosinophil numbers/hpf in rectosigmoid colonic biopsy samples from normal and pediatric UC patients. d and e, Representative anti-EPO-immunostained rectosigmoid colonic biopsy samples from normal (d) and pediatric UC (e) patients. f, Correlation analysis of rectosigmoid eosinophil levels per hpf and disease histological score of rectosigmoid colonic biopsy samples from normal and pediatric patients. c is presented as the median ± 25% and 75% percentile (the lower and upper quartiles, respectively), and minimum and maximum limit (whiskers) (magnification: ad, ×50; insets, ×200).
FIGURE 2
FIGURE 2
Eotaxin subfamily expression in pediatric UC; eotaxin-1, -, and -3 expression in normal and UC patients. a, Eotaxin-1, -2, and -3 normalized expression in normal patients (normals) and UC patients by microarray analysis. b, Correlation between eosinophils/hpf of rectosigmoid colon and eotaxin-1 mRNA expression by microarray analysis (Spearman R = 0.70; p < 0.05). c and d, Quantitative analysis of eotaxin-1, -2, and -3 mRNA levels in normal and UC patients using real-time PCR analysis. The levels of eotaxin-1 (c), and eotaxin-2 (d), and eotaxin-3 (e) mRNA are shown. Each mRNA value is normalized to HPRT mRNA and is expressed as fold change. a, RNA from each patient was subjected to chip analysis using Affymetrix Human Genome U133 Plus 2.0 GeneChips. Data were normalized to allow for array to array comparisons, and differences between groups were detected in GeneSpring with a significance at the 0.05 level and mean fold change of 2 relative to healthy control samples. ce, The graphs are standard box and whisker plots, providing median, 25th and 75th percentiles, and minimum and maximum limit (whiskers). The number of subjects was seven and five for normal and UC patients, respectively.
FIGURE 3
FIGURE 3
Role of eosinophils in DSS-induced colitis. a, Correlation analysis between eosinophils/mm2 in the colon vs the histological score of colons of WT mice treated with 2.5% DSS for 8 days. Histological score of colon (b) and colon length (c) of WT and eosinophil deficient (PHIL) mice treated with 2.5% DSS for 8 days. Representative photomicrographs of H&E-stained colonic sections from DSS-challenged WT (d) and PHIL (e) mice. a, Correlation analysis was performed by Spearman’s correlation analysis. b, Each symbol represents one mouse and the line indicates the mean; c, Data represent mean ± SD. d and e, Magnification of photomicrographs is ×50.
FIGURE 4
FIGURE 4
Eosinophils and eotaxin-1 and -2 expression in DSS-induced colitis. a, Eosinophil/mm2 in the mucosal and submucosal compartment (upper panel) and eotaxin-1 and eotaxin-2 mRNA expression (lower panel) in the colons of WT mice treated for 0 – 8 days with 2.5% DSS. Ethidium bromide (ETBr)-stained gel is shown to demonstrate RNA quality. Eotaxin-1 and -2 mRNA expression is shown as two mice per time point. b, Eosinophils/hpf in the submucosal of the colon of WT (SV129/Svev/C57BL/6) and eotaxin-2−/− and eotaxin-1/-2−/− mice treated with 2.5% DSS for 8 days. Data represent the mean ± SEM of 4 –5 random sections per mouse for 3– 6 mice per group; n = 2 experiments.
FIGURE 5
FIGURE 5
DSS exposure induced mononuclear cell-derived eotaxin-1 mRNA expression. Colonic sections were subjected to in situ hybridization using an eotaxin-1 antisense probe. The hybridization signal of the eotaxin-1 probe is shown in a representative colon from control-treated (a and b) and DSS-treated (c and e) mice. Brightfield (a, c, and e) and darkfield (b and d) images original magnifications of ×100 (ad) and ×1000; scale bar = 50 μm (e). Arrows indicate eotaxin-1 expression in mononuclear cells (signal grains appear bright in darkfield images and dark in brightfield images).
FIGURE 6
FIGURE 6
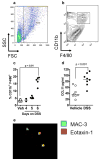
F4/80+ CD11b+ myeloid cells express eotaxin-1 in DSS-induced colitis. a and b, Flow cytometric identification of intestinal F4/80+ CD11b+ myeloid cells. Representative dot and contour plots of Intestinal F4/80+ CD11b+ myeloid cells identified by FSChighSSChigh, F4/80+CD11b+ cells (where FSC is forward scatter and SSC is side scatter). c, Levels of intestinal F4/80+CD11b+ myeloid cells in the colon of control (Veh) and 2.5% DSS-treated WT mice. d, Eotaxin-1 levels in purified intestinal macrophage homogenates from control (Vehicle) and DSS-treated WT mice. e, Immunofluorescence labeling for eotaxin-1 and Mac-3 in adherent purified intestinal macrophages from DSS-treated WT mice. Overlay image of anti-eotaxin-1-Alexa Fluor 594, (green) and anti-Mac-3-Alexa Fluor 488 (red). Original magnification, ×200. a and b, Representative dot and contour plot from triplicate experiments. c and d, Individual symbol represents one mouse and the dash represents median value.
FIGURE 7
FIGURE 7
Cellular expression of eotaxin-1 in DSS-induced colitis and UC. Upper panels, Immunofluorescence labeling for eotaxin-1 and F4/80 in the colon of DSS-treated WT mice. A, Anti-eotaxin-1-Alexa Fluor 594, (green). B, Anti-F4/80-Alexa Fluor 488 (red). C, Nuclei were stained with DAPI (blue). D, Overlay of all AC. Original magnification, ×200. White arrows depict F4/80+ and eotaxin-1 cells; yellow arrows depict F4/80+ and eotaxin-1+ cells. Lower panels, Immunofluorescence labeling for CD68 and eotaxin-1 in colonic biopsy samples from UC patients. Anti-eotaxin-1-Alexa Fluor 488 is green; anti-CD68-TRITC (red) nuclei were stained with DAPI (blue). Results shown are representative of three cases. Original magnification for top panels was ×50 and that for bottom panels was ×50 and ×200.

References

    1. Bouma G, Strober W. The immunological and genetic basis of inflammatory bowel disease. Nat Rev Immunol. 2003;3:521–533. - PubMed
    1. Walsh RE, Gaginella TS. The eosinophil in inflammatory bowel disease. Scand J Gastrorenterol. 1991;26:1217–1224. - PubMed
    1. Desreumaux P, Nutten S, Colombel JF. Activated eosinophils in inflammatory bowel disease: do they matter? Am J Gastroenterol. 1999;94:3396 –3398. - PubMed
    1. Nishitani H, Okabayashi M, Satomi M, Shimoyama T, Dohi Y. Infiltration of peroxidase-producing eosinophils into the lamina propria of patients with ulcerative colitis. J Gastroenterol. 1998;33:189 –195. - PubMed
    1. Rothenberg ME, Hogan SP. The eosinophil. Annu Rev Immunol. 2006;24:147–174. - PubMed

Publication types

MeSH terms