. 2008 Nov 3;183(3):393-400.
doi: 10.1083/jcb.200804010.

Toll-like receptor 4 restricts retinal progenitor cell proliferation

Affiliations

Toll-like receptor 4 restricts retinal progenitor cell proliferation

Ravid Shechter et al. J Cell Biol. .

Abstract

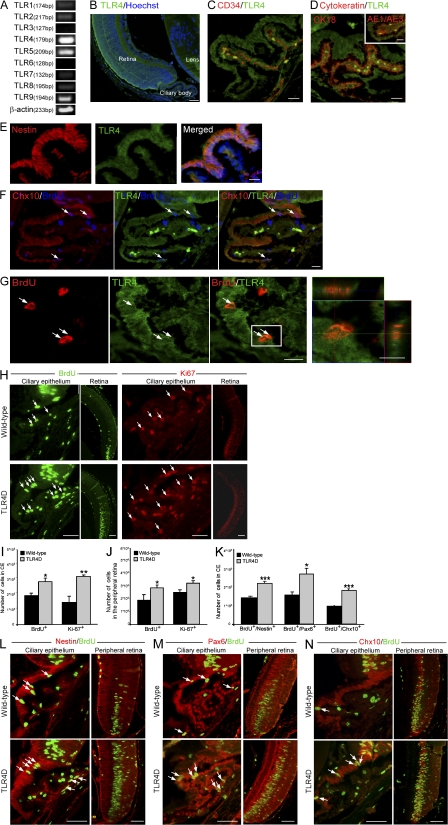
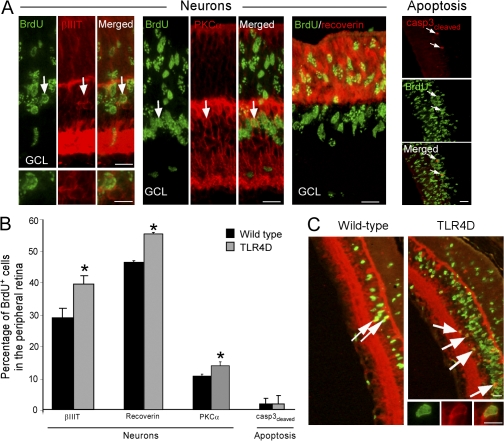
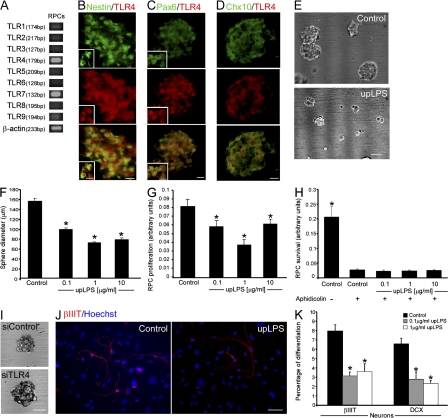
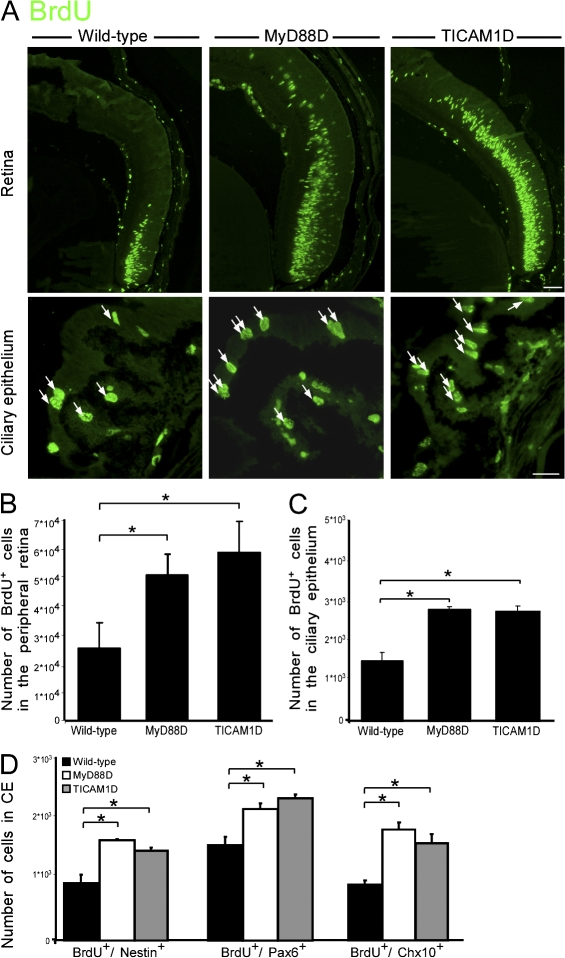
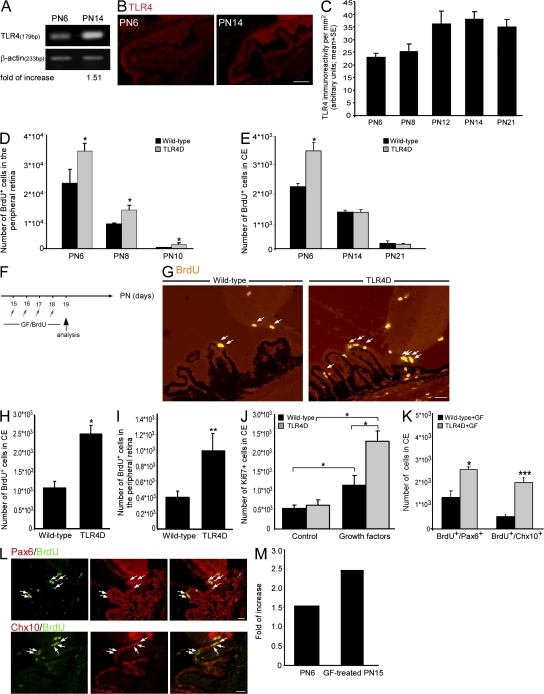
Retinal neurogenesis ceases by the early postnatal period, although retinal progenitor cells (RPCs) persist throughout life. In this study, we show that in the mammalian eye, the function of Toll-like receptor 4 (TLR4) extends beyond regulation of the innate immune response; it restricts RPC proliferation. In TLR4-deficient mice, enhanced proliferation of cells reminiscent of RPCs is evident during the early postnatal period. In vitro experiments demonstrate that TLR4 acts as an intrinsic regulator of RPC fate decision. Increased TLR4 expression in the eye correlates with the postnatal cessation of cell proliferation. However, deficient TLR4 expression is not sufficient to extend the proliferative period but rather contributes to resumption of proliferation in combination with growth factors. Proliferation in vivo is inhibited by both MyD88-dependent and -independent pathways, similar to the mechanisms activated by TLR4 in immune cells. Thus, our study attributes a novel role to TLR4 as a negative regulator of RPC proliferation.


Figures

Figure 1.
Figure 1.
Deficiency in TLR4 results in increased proliferation of cells reminiscent of RPCs in the early postnatal retina. (A) Semiquantitative PCR of PN6 whole eyes for TLR1–9. (B) Staining for TLR4 of a PN6 eye. (C and D) Pictures of the CE labeled with TLR4 and the endothelial marker CD34 (C) or the epithelial markers cytokeratin 18 (CK18) and AE1/AE3 (D, inset). (E and F) Staining for nestin and TLR4 coexpression (E) or BrdU, Chx10, and TLR4 (F) in the CE. (G) Labeling of BrdU and TLR4 in the CE; right panel is a z axis projection of the boxed area. (H) Pictures of BrdU or Ki67 in the CE and the peripheral retina of WT and TLR4D PN6 mice. (I and J) Quantification of proliferating cells in the CE (I) and in the peripheral retina (J). (K) Quantification of BrdU+/nestin+, BrdU+/Pax6+, and BrdU+/Chx10+ cells. (L–N) Representative pictures of nestin/BrdU (L), Pax6/BrdU (M), and Chx10/BrdU (N) staining. Arrows indicate double-labeled cells. Asterisks denote significant differences between the indicated groups: *, P < 0.05; **, P < 0.01; ***, P < 0.001; Student's t test, n = 4. Error bars represent SEM. Bars: (B) 100 μm; (C–G) 20 μm; (individual cell in G) 10 μm; (H and L–N) 50 μm.
Figure 2.
Figure 2.
Deficiency in TLR4 in the early postnatal retina results in increased neuronal differentiation. (A) Staining for BrdU and the neuronal cell-specific markers βIIIT, PKC-α, and recoverin or the apoptotic marker cleaved caspase 3. (B) Percentage of BrdU+ cells coexpressing each of the tested markers out of the total BrdU+ cells (Student's t test, n = 4 per group; *, P < 0.05). Error bars represent SEM. (C) Staining for BrdU and the neuronal marker DCX in retinas of WT and TLR4D mice. Arrows indicate double-labeled cells. Bars: (A and C) 20 μm; (individual cells) 10 μm.
Figure 3.
Figure 3.
Activation of TLR4 on RPCs directly restricts their proliferation and neuronal differentiation in vitro. (A) Semiquantitative PCR analysis of RPCs for TLR expression. (B–D) RPC spheres stained for TLR4 and the neural progenitor marker nestin (B) or the retinal progenitor markers Pax6 (C) and Chx10 (D). Insets depict single cells at higher magnification. (E) Pictures of RPC spheres with or without upLPS treatment. (F) Quantification of sphere diameter in the presence of upLPS (factorial ANOVA: F = 177.5; *, P = 0.0001). (G and H) Effect of upLPS on RPC proliferation (G; factorial ANOVA: F = 7.434; *, P = 0.0008) and survival (H; factorial ANOVA: F = 46.27; *, P = 0.0001) determined by XTT assay. (I) Pictures of RPCs treated with siRNA for TLR4. (J) Differentiated RPCs with or without upLPS treatment stained for βIIIT. (K) Percentages of RPC differentiation to βIIIT+ or DCX+ cells (factorial ANOVA: βIIIT, F = 16.92; *, P = 0.0001; and DCX, F = 14.73; *, P = 0.0003). Factorial ANOVA followed by Fisher's exact test; *, P = 0.05. Error bars represent SEM. Bars: (B–D) 20 μm; (individual cells) 10 μm; (E) 100 μm; (I and J) 50 μm.
Figure 4.
Figure 4.
Deficiency in the intracellular adaptors MyD88 or TICAM1 increases proliferation in the retinas of PN6 mice. (A) Representative pictures of MyD88-deficient (MyD88D), TICAM1-deficient (TICAM1D), and WT PN6 retinas stained for BrdU. Arrows indicate BrdU+ cells. Bars: (top) 50 μm; (bottom) 20 μm. (B and C) Quantification of BrdU+ cells in the peripheral retina (B; factorial ANOVA: F = 7.529; *, P = 0.0064) or in the CE (C; factorial ANOVA: F = 24.2; *, P = 0.0002). (D) Quantification of BrdU+/nestin+ (factorial ANOVA: F = 11.2; *, P = 0.003), BrdU+/Pax6+ (factorial ANOVA: F = 6.32; *, P = 0.019), and BrdU+/Chx10+ (factorial ANOVA: F = 43.8; *, P = 0.0001) cells. Factorial ANOVA followed by Fisher's exact test; *, P = 0.05; n = 4–8. Error bars represent SEM.
Figure 5.
Figure 5.
TLR4 regulates the responsiveness of cells reminiscent of RPCs after administration of GFs. (A) Semiquantitative PCR of PN6 and PN14 whole eyes for TLR4. (B and C) Pictures (B) and quantification (C; factorial ANOVA: F = 4.069; *, P = 0.0434) of TLR4 immunoreactivity at various time points. (D and E) Quantification of BrdU+ cells in the peripheral retina (D) and in CE (E; factorial ANOVA: F = 323; *, P = 0.0001 in D and F = 128; *, P = 0.0001 in E). (F) Experimental design. TLR4D and WT PN15 mice received intravitreal injections of FGF-2 and insulin. (G) Staining for BrdU after GF treatment. Arrows indicate BrdU+ cells. (H and I) Quantification of BrdU+ cells in the CE (H) and in the peripheral retina (I; Student's t test; *, P < 0.05; **, P < 0.01) after GF treatment. (J) Quantification of Ki67+ cells in the CE of untreated and GF-treated mice (factorial ANOVA: F = 7.529; *, P = 0.0064). (K) Quantification of BrdU+/Pax6+ and BrdU+/Chx10+ cells after GF treatment (Student's t test; *, P < 0.05; ***, P < 0.001). (L) Pictures of TLR4D retinas after GF treatment labeled for BrdU, Pax6, and Chx10. Arrows indicate double-positive cells. (M) Fold increase in BrdU+ cells in TLR4D retinas relative to control. Factorial ANOVA followed by Fisher's exact test; *, P = 0.05; n = 4–6. Asterisks denote significant differences. Error bars represent SEM. Bars, 25 μm.

References

    1. Ahmad, I., L. Tang, and H. Pham. 2000. Identification of neural progenitors in the adult mammalian eye. Biochem. Biophys. Res. Commun. 270:517–521. - PubMed
    1. Akira, S., and K. Takeda. 2004. Toll-like receptor signalling. Nat. Rev. Immunol. 4:499–511. - PubMed
    1. Anderson, K.V., L. Bokla, and C. Nusslein-Volhard. 1985. Establishment of dorsal-ventral polarity in the Drosophila embryo: the induction of polarity by the Toll gene product. Cell. 42:791–798. - PubMed
    1. Biemar, F., D.A. Nix, J. Piel, B. Peterson, M. Ronshaugen, V. Sementchenko, I. Bell, J.R. Manak, and M.S. Levine. 2006. Comprehensive identification of Drosophila dorsal-ventral patterning genes using a whole-genome tiling array. Proc. Natl. Acad. Sci. USA. 103:12763–12768. - PMC - PubMed
    1. Blanks, J.C., and D. Bok. 1977. An autoradiographic analysis of postnatal cell proliferation in the normal and degenerative mouse retina. J. Comp. Neurol. 174:317–327. - PubMed

Publication types