. 2008 Nov 24;205(12):2873-86.
doi: 10.1084/jem.20080840. Epub 2008 Nov 3.

ICOS-dependent extrafollicular helper T cells elicit IgG production via IL-21 in systemic autoimmunity

Affiliations

ICOS-dependent extrafollicular helper T cells elicit IgG production via IL-21 in systemic autoimmunity

Jared M Odegard et al. J Exp Med. .

Abstract

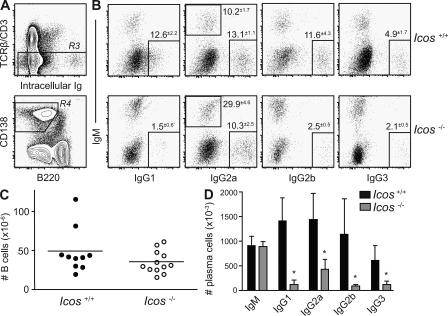
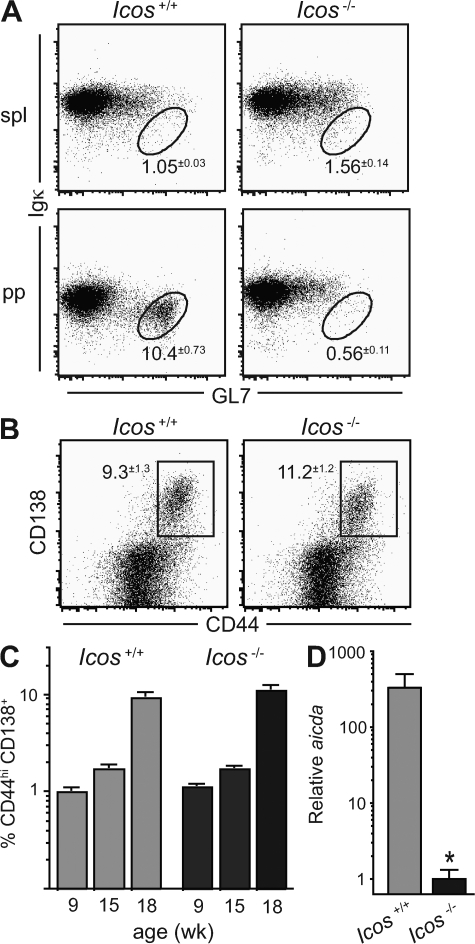
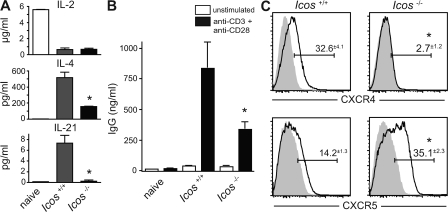
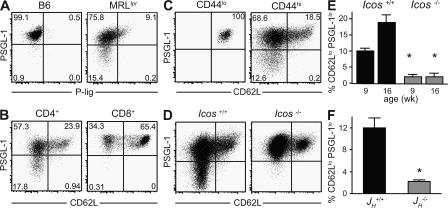
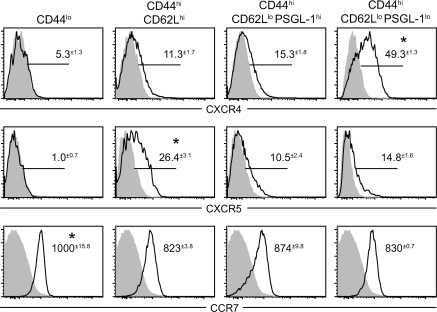
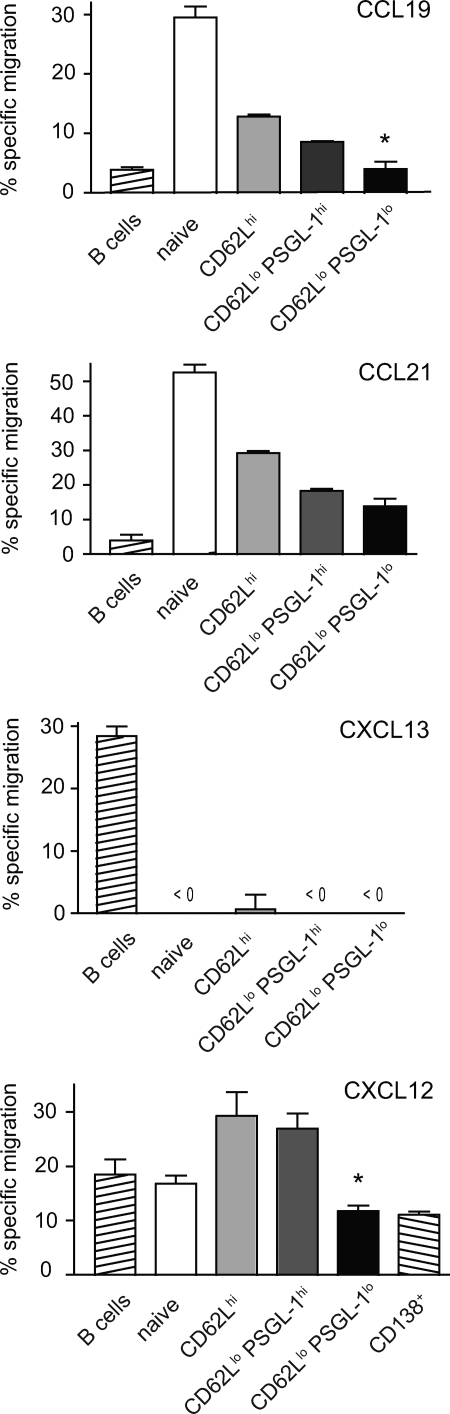
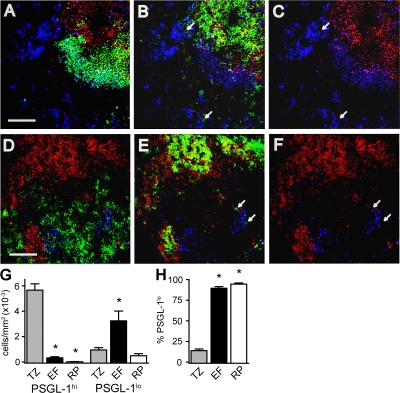
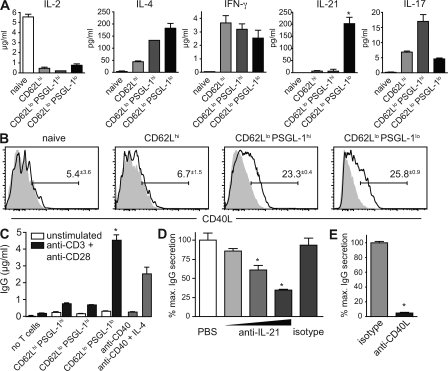
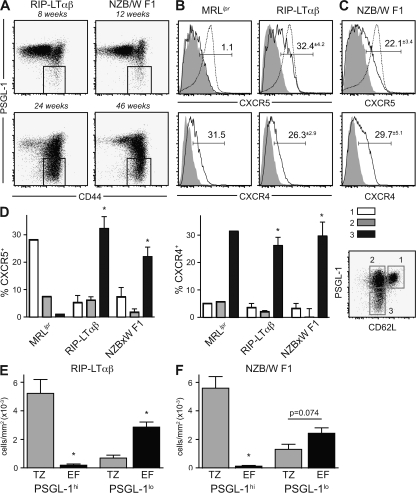
The role of specialized follicular helper T (T(FH)) cells in the germinal center has become well recognized, but it is less clear how effector T cells govern the extrafollicular response, the dominant pathway of high-affinity, isotype-switched autoantibody production in the MRL/MpJ-Fas(lpr) (MRL(lpr)) mouse model of lupus. MRL(lpr) mice lacking the Icos gene have impaired extrafollicular differentiation of immunoglobulin (Ig) G(+) plasma cells accompanied by defects in CXC chemokine receptor (CXCR) 4 expression, interleukin (IL) 21 secretion, and B cell helper function in CD4 T cells. These phenotypes reflect the selective loss of a population of T cells marked by down-regulation of P-selectin glycoprotein ligand 1 (PSGL-1; also known as CD162). PSGL-1(lo) T cells from MRL(lpr) mice express CXCR4, localize to extrafollicular sites, and uniquely mediate IgG production through IL-21 and CD40L. In other autoimmune strains, PSGL-1(lo) T cells are also abundant but may exhibit either a follicular or extrafollicular phenotype. Our findings define an anatomically distinct extrafollicular population of cells that regulates plasma cell differentiation in chronic autoimmunity, indicating that specialized humoral effector T cells akin to T(FH) cells can occur outside the follicle.


Figures

Figure 1.
Figure 1.
ICOS is required for generation of IgG+ plasma cells. (A) Plasma cells were identified in the spleens of 23-wk-old Icos+/+ and Icos−/− MRLlpr animals (n = 3–5 for two experiments) by expression of CD138 and down-regulation of B220 (R4) after exclusion of T cells and autofluorescent cells (R3). (B) The percentage of plasma cells within R4 producing each antibody isotype are shown, as determined by intracellular Ig staining. Mean gate frequencies ± SEM are shown. (C) Absolute number of CD90 CD19+ B cells in the spleen (n = 10–12). Horizontal bars indicate means. (D) Absolute numbers of plasma cells were calculated by multiplying the fraction of live single cells positive for each isotype by the total cell number. Data are expressed as means ± SEM. *, P ≤ 0.05 versus Icos+/+ mice using the Mann-Whitney test.
Figure 2.
Figure 2.
AID expression in extrafollicular plasmablasts, but not their formation, requires ICOS. (A) Percentage of GL7hi Igκlo GC B cells, gated on CD19, in the spleens (spl) and Peyer's patches (pp) of Icos+/+ and Icos−/− MRLlpr mice (n = 4–5 for two experiments). (B) Percentage of CD44+ cells bearing the early plasmablast marker CD138 (reference 43) in the TCRβ CD19+ B cell compartment of 18-wk-old Icos+/+ and Icos−/− mice (n = 4–6 for three experiments). (C) Percentage of CD90 CD19+ B cells expressing CD138 and high levels of CD44 at the indicated ages (n = 4–14 per age group; three pooled experiments are shown). (D) Plasmablasts were sorted from Icos+/+ and Icos−/− mice as gated in B, and expression of aicda mRNA encoding AID was determined by quantitative PCR (two pooled mice per experiment and two experimental replicates shown). All data are displayed as means ± SEM. *, P ≤ 0.05 versus Icos+/+ mice using the Student's t test.
Figure 3.
Figure 3.
Icos−/− effector T cells have defects in cytokine production, helper function, and CXCR4, but not CXCR5, expression. (A) Sorted TCRβ+ CD4+ B220 CD44hi CD62Llo effector T cells from Icos+/+ and Icos−/− mice were cultured with PMA and ionomycin for 24 h, and the indicated cytokines were measured in the supernatants. Icos+/+ CD44lo CD62Lhi naive T cells were stimulated as a control (representative of two experiments). (B) Effector CD4 cells were sorted as in A and cultured with sorted CD19+ B220+ CD90 CD44lo naive B cells from 8-wk-old mice in the presence or absence of anti-CD3 and anti-CD28. After 96 h, secreted IgG was measured in the culture supernatant (representative of three experiments). (C) Expression of CXCR4 and CXCR5 on CD4+ B220 T cells from 20-wk-old mice was determined by FACS (n = 3 for three experiments). The continuous line indicates specific staining, and the gray shading indicates isotype control. Values indicate the percent positive minus isotype control. All data are presented as means ± SEM. *, P ≤ 0.05 versus Icos+/+ using the Student's t test.
Figure 4.
Figure 4.
A novel population of CD4 T cells marked by PSGL-1 down-regulation requires both ICOS and B cells for their development. (A) B220 TCRβ+ CD4+ T cells from B6 and MRLlpr mice were stained with anti-PSGL-1 and a P-selectin–Ig fusion protein to detect P-lig. (B and C) TCRβ+ B220 T cells were gated on CD4 or CD8, and CD4+ cells were separated according to CD44 expression, as indicated, and the expression of PSGL-1 and CD62L was determined on these populations. (D) Expression of PSGL-1 and CD62L on CD4+ B220 T cells from Icos+/+ and Icos−/− mice was determined by FACS. Percentages are shown. (E) The percentages of CD4 T cells that had down-regulated PSGL-1 at 9 and 16 wk of age are shown (n = 4–7). (F) The percentage of PSGL-1lo T cells in 25-wk-old B cell–deficient JH−/− MRLlpr mice was compared with age-matched JH+/+ controls (n = 3). A–D show representative data from a minimum of five animals. Data in E and F are expressed as means ± SEM. *, P ≤ 0.05 compared with age-matched controls using the Student's t test.
Figure 5.
Figure 5.
PSGL-1lo T cells have an extrafollicular chemokine receptor profile. Expression levels of the chemokine receptors CXCR4, CXCR5, and CCR7 were compared between naive CD4 T cells and three subsets of CD44hi effector cells gated according to the expression of CD62L and PSGL-1, as in Fig. 4 C (n = 3 for three experiments). Specific staining is indicated by the solid line, and isotype control staining is indicated by the gray shading. For CXCR4 and CXCR5, values indicate the mean percent positive minus isotype control ± SEM. For CCR7, values are the mean fluorescence intensity ± SEM. *, P < 0.05 compared with all other groups using the Student's t test.
Figure 6.
Figure 6.
PSGL-1lo T cells from MRLlpr mice have chemotactic properties consistent with extrafollicular localization. Migration of T cell subsets or control populations to the ligands for CCR7 (CCL19 and CCL21), CXCR5 (CXCL13), and CXCR4 (CXCL12) in a Transwell chemotaxis assay. Error bars indicate means ± SEM, and results are representative of three experiments. *, P < 0.05 compared with CD62Llo PSGL-1hi cells using the Student's t test.
Figure 7.
Figure 7.
PSGL-1lo T cells localize to the extrafollicular focus. Four-color immunofluorescence microscopy was used to determine the expression of PSGL-1 on CD4 T cells in extrafollicular sites. For clarity, each panel displays two or three of the four channels. One field is represented in A–C, and another is represented in D–F. In all panels, red and blue signals indicate PSGL-1 and IgM staining, respectively. Green indicates B220 in A, F4/80 in D, and CD4 in B and E, and is left blank in C and F. White arrows highlight the location of extrafollicular CD4+ cells. Bar, 100 μm. (G and H) Enumeration of CD4 T cells expressing or lacking PSGL-1 in splenic T cell zones, extrafollicular sites, and the red pulp. The number of cells per millimeter squared in each site (G) and the percentage of CD4+ cells lacking PSGL-1 at each site (H) were determined from immunofluorescence micrographs. 100–300 cells, from multiple sections, were scored per mouse, n = 4. *, P < 0.05 compared with the T cell zone. EF, extrafollicular focus; RP, red pulp; TZ, T cell zone.
Figure 8.
Figure 8.
PSGL-1lo T cells are unique in their ability to promote IgG secretion via IL-21. (A) TCRβ+ CD4+ B220 CD44hi effector cells were separated according to their expression of CD62L and PSGL-1 and were cultured with PMA and ionomycin for 24 h, and the indicated cytokines were measured in the supernatants. CD44lo CD62Lhi naive T cells were stimulated as a negative control. Results are representative of three experiments. (B) Percent expression of CD40L on the indicated subsets was determined by FACS (n = 3). Specific staining is indicated by a continuous line, and isotype control staining is indicated by gray shading. (C) Effector CD4 cells were sorted as in A and cultured with sorted CD19+ B220+ CD90 CD44lo naive B cells from young mice in the presence or absence of anti-CD3 and anti-CD28. After 96 h, secreted IgG was measured in the culture supernatant. B cell stimulation with an optimal dose of anti-CD40 with or without IL-4 is shown for comparison. Results are representative of three experiments. (D) IL-21 blocking antibody was added at fourfold increasing concentrations to a co-culture of naive B cells with PSGL-1lo effector cells. Isotype control antibody was added at maximum concentration. (E) CD40L blocking antibody MR1 or isotype control was added to similar co-cultures. D and E are representative of two experiments each. All data are shown as means ± SEM. *, P < 0.05 compared with other effector subsets (A and C) or isotype control (D and E) using the Student's t test.
Figure 9.
Figure 9.
PSGL-1lo extrafollicular T cells occur in other autoimmune models. (A) The percentage of CD44hi PSGL-1lo cells within the CD4 T cell compartment of RIP-LTαβ and NZB/W F1 mice. 6–10 mice at varying ages were analyzed, and representative plots of the indicated ages are shown. (B and C) Expression of CXCR5 and CXCR4 on PSGL-1lo cells from 24-wk-old RIP-LTαβ (B) and 46-wk-old NZB/W F1 (C) mice. Continuous lines indicate PSGL-1lo effectors, gray-shaded histograms indicate CD44lo CD62Lhi naive CD4 T cells, and dotted lines indicate B cells. An MRLlpr control was stained concomitantly with the RIP-LTαβ group; profiles may also be compared with Fig. 5. Gate frequencies above background are shown. (D) Plots of CXCR5 and CXCR4 expression on effector subsets separated by CD62L and PSGL-1 expression. *, P < 0.05 compared with PSGL-1hi effector subsets using the Student's t test. (E and F) The number of cells per millimeter squared in each site in RIP-LTαβ (E) and NZB/W F1 (F) spleens were determined from immunofluorescence micrographs as in Fig. 7. 100–300 cells across multiple sections were counted per mouse (n = 4–6 mice per group). *, P < 0.05 compared with the T cell zone using the Student's t test. EF, extrafollicular focus; TZ, T cell zone.

References

    1. Reinhardt, R.L., S.J. Kang, H.E. Liang, and R.M. Locksley. 2006. T helper cell effector fates–who, how and where? Curr. Opin. Immunol. 18:271–277. - PubMed
    1. Mosmann, T.R., and R.L. Coffman. 1989. TH1 and TH2 cells: different patterns of lymphokine secretion lead to different functional properties. Annu. Rev. Immunol. 7:145–173. - PubMed
    1. Abbas, A.K., K.M. Murphy, and A. Sher. 1996. Functional diversity of helper T lymphocytes. Nature. 383:787–793. - PubMed
    1. Kaplan, M.H., U. Schindler, S.T. Smiley, and M.J. Grusby. 1996. Stat6 is required for mediating responses to IL-4 and for development of Th2 cells. Immunity. 4:313–319. - PubMed
    1. Okada, T., and J.G. Cyster. 2006. B cell migration and interactions in the early phase of antibody responses. Curr. Opin. Immunol. 18:278–285. - PubMed

Publication types

MeSH terms