

Live Candida albicans suppresses production of reactive oxygen species in phagocytes
- PMID: 18981256
- PMCID: PMC2612242
- DOI: 10.1128/IAI.00860-08
Live Candida albicans suppresses production of reactive oxygen species in phagocytes
Abstract
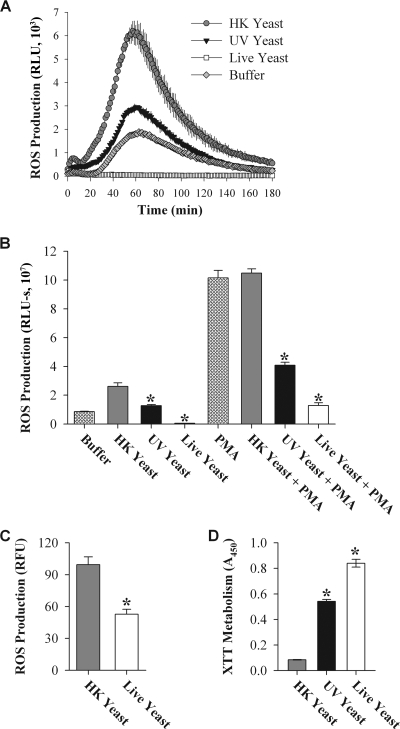
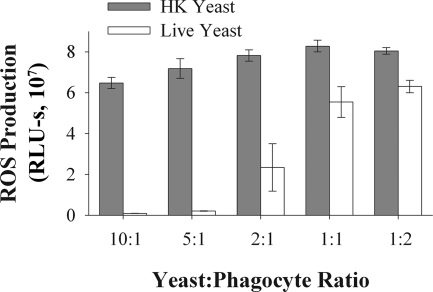
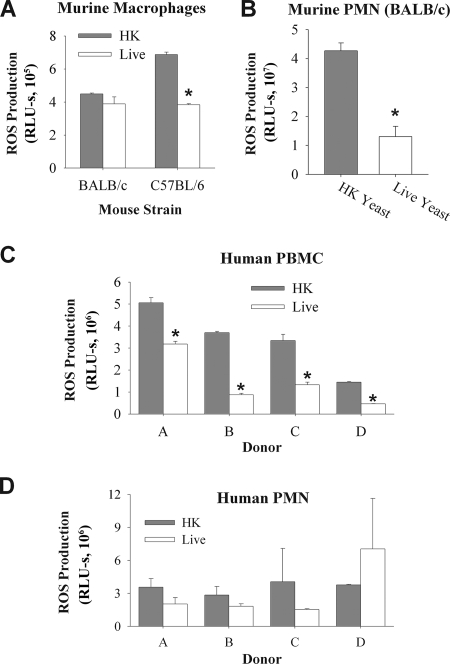
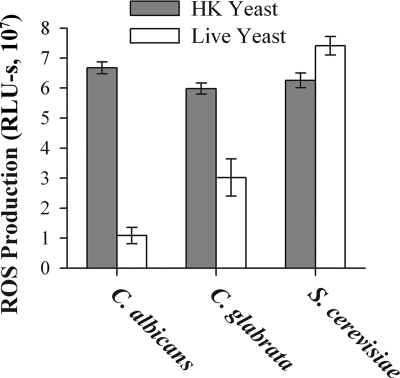
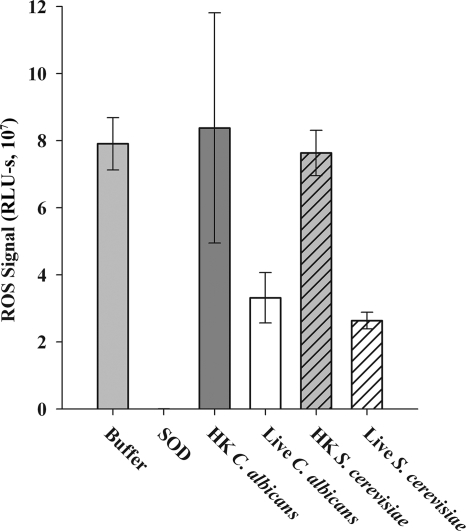
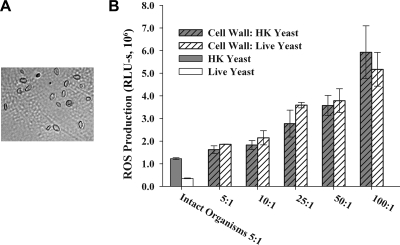
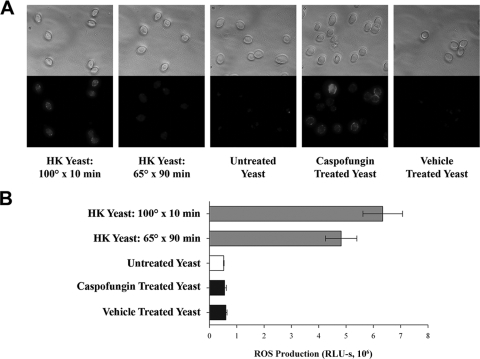
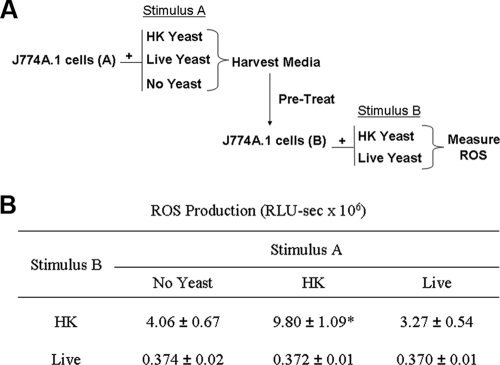
Production of reactive oxygen species (ROS) is an important aspect of phagocyte-mediated host responses. Since phagocytes play a crucial role in the host response to Candida albicans, we examined the ability of Candida to modulate phagocyte ROS production. ROS production was measured in the murine macrophage cell line J774 and in primary phagocytes using luminol-enhanced chemiluminescence. J774 cells, murine polymorphonuclear leukocytes (PMN), human monocytes, and human PMN treated with live C. albicans produced significantly less ROS than phagocytes treated with heat-killed C. albicans. Live C. albicans also suppressed ROS production in murine bone marrow-derived macrophages from C57BL/6 mice, but not from BALB/c mice. Live C. albicans also suppressed ROS in response to external stimuli. C. albicans and Candida glabrata suppressed ROS production by phagocytes, whereas Saccharomyces cerevisiae stimulated ROS production. The cell wall is the initial point of contact between Candida and phagocytes, but isolated cell walls from both heat-killed and live C. albicans stimulated ROS production. Heat-killed C. albicans has increased surface exposure of 1,3-beta-glucan, a cell wall component that can stimulate phagocytes. To determine whether surface 1,3-beta-glucan exposure accounted for the difference in ROS production, live C. albicans cells were treated with a sublethal dose of caspofungin to increase surface 1,3-beta-glucan exposure. Caspofungin-treated C. albicans was fully able to suppress ROS production, indicating that suppression of ROS overrides stimulatory signals from 1,3-beta-glucan. These studies indicate that live C. albicans actively suppresses ROS production in phagocytes in vitro, which may represent an important immune evasion mechanism.
Figures
Similar articles
-
Thriving within the host: Candida spp. interactions with phagocytic cells.Med Microbiol Immunol. 2013 Jun;202(3):183-95. doi: 10.1007/s00430-013-0288-z. Epub 2013 Jan 25. Med Microbiol Immunol. 2013. PMID: 23354731 Review.
-
Impaired phagocytosis directs human monocyte activation in response to fungal derived β-glucan particles.Eur J Immunol. 2018 May;48(5):757-770. doi: 10.1002/eji.201747224. Epub 2018 Feb 5. Eur J Immunol. 2018. PMID: 29313961 Free PMC article.
-
Hypoxia Promotes Immune Evasion by Triggering β-Glucan Masking on the Candida albicans Cell Surface via Mitochondrial and cAMP-Protein Kinase A Signaling.mBio. 2018 Nov 6;9(6):e01318-18. doi: 10.1128/mBio.01318-18. mBio. 2018. PMID: 30401773 Free PMC article.
-
Candida albicans β-Glucan-Containing Particles Increase HO-1 Expression in Oral Keratinocytes via a Reactive Oxygen Species/p38 Mitogen-Activated Protein Kinase/Nrf2 Pathway.Infect Immun. 2018 Mar 22;86(4):e00575-17. doi: 10.1128/IAI.00575-17. Print 2018 Apr. Infect Immun. 2018. PMID: 29311246 Free PMC article.
-
Oxidative and nitrosative stress on phagocytes' function: from effective defense to immunity evasion mechanisms.Arch Immunol Ther Exp (Warsz). 2011 Dec;59(6):441-8. doi: 10.1007/s00005-011-0144-z. Epub 2011 Oct 5. Arch Immunol Ther Exp (Warsz). 2011. PMID: 21972015 Review.
Cited by
-
Tobacco Hornworm (Manduca sexta) caterpillars as a novel host model for the study of fungal virulence and drug efficacy.Virulence. 2020 Dec;11(1):1075-1089. doi: 10.1080/21505594.2020.1806665. Virulence. 2020. PMID: 32842847 Free PMC article.
-
Thriving within the host: Candida spp. interactions with phagocytic cells.Med Microbiol Immunol. 2013 Jun;202(3):183-95. doi: 10.1007/s00430-013-0288-z. Epub 2013 Jan 25. Med Microbiol Immunol. 2013. PMID: 23354731 Review.
-
Neutrophil extracellular traps in fungal infection.Semin Cell Dev Biol. 2019 May;89:47-57. doi: 10.1016/j.semcdb.2018.03.020. Epub 2018 Apr 4. Semin Cell Dev Biol. 2019. PMID: 29601861 Free PMC article. Review.
-
The Fungal Histone Acetyl Transferase Gcn5 Controls Virulence of the Human Pathogen Candida albicans through Multiple Pathways.Sci Rep. 2019 Jul 1;9(1):9445. doi: 10.1038/s41598-019-45817-5. Sci Rep. 2019. PMID: 31263212 Free PMC article.
-
Immunopathology of Recurrent Vulvovaginal Infections: New Aspects and Research Directions.Front Immunol. 2019 Aug 28;10:2034. doi: 10.3389/fimmu.2019.02034. eCollection 2019. Front Immunol. 2019. PMID: 31555269 Free PMC article. Review.
References
-
- Allen, L. A., B. R. Beecher, J. T. Lynch, O. V. Rohner, and L. M. Wittine. 2005. Helicobacter pylori disrupts NADPH oxidase targeting in human neutrophils to induce extracellular superoxide release. J. Immunol. 1743658-3667. - PubMed
-
- Ashman, R. B. 1998. Candida albicans: pathogenesis, immunity and host defence. Res. Immunol. 149281-288. - PubMed
-
- Balish, E., T. F. Warner, P. J. Nicholas, E. E. Paulling, C. Westwater, and D. A. Schofield. 2005. Susceptibility of germfree phagocyte oxidase- and nitric oxide synthase 2-deficient mice, defective in the production of reactive metabolites of both oxygen and nitrogen, to mucosal and systemic candidiasis of endogenous origin. Infect. Immun. 731313-1320. - PMC - PubMed
-
- Bliss, J. M., K. P. Basavegowda, W. J. Watson, A. U. Sheikh, and R. M. Ryan. 2008. Vertical and horizontal transmission of Candida albicans in very low birth weight infants using DNA fingerprinting techniques. Pediatr. Infect. Dis. J. 27231-235. - PubMed
Publication types
MeSH terms
Substances
Grants and funding
LinkOut - more resources
Full Text Sources
Other Literature Sources
