. 2008 Nov;79(5):760-7.

A magnetic resonance imaging study of intestinal dilation in Trypanosoma cruzi-infected mice deficient in nitric oxide synthase

Affiliations

A magnetic resonance imaging study of intestinal dilation in Trypanosoma cruzi-infected mice deficient in nitric oxide synthase

Lars Ny et al. Am J Trop Med Hyg. 2008 Nov.

Abstract

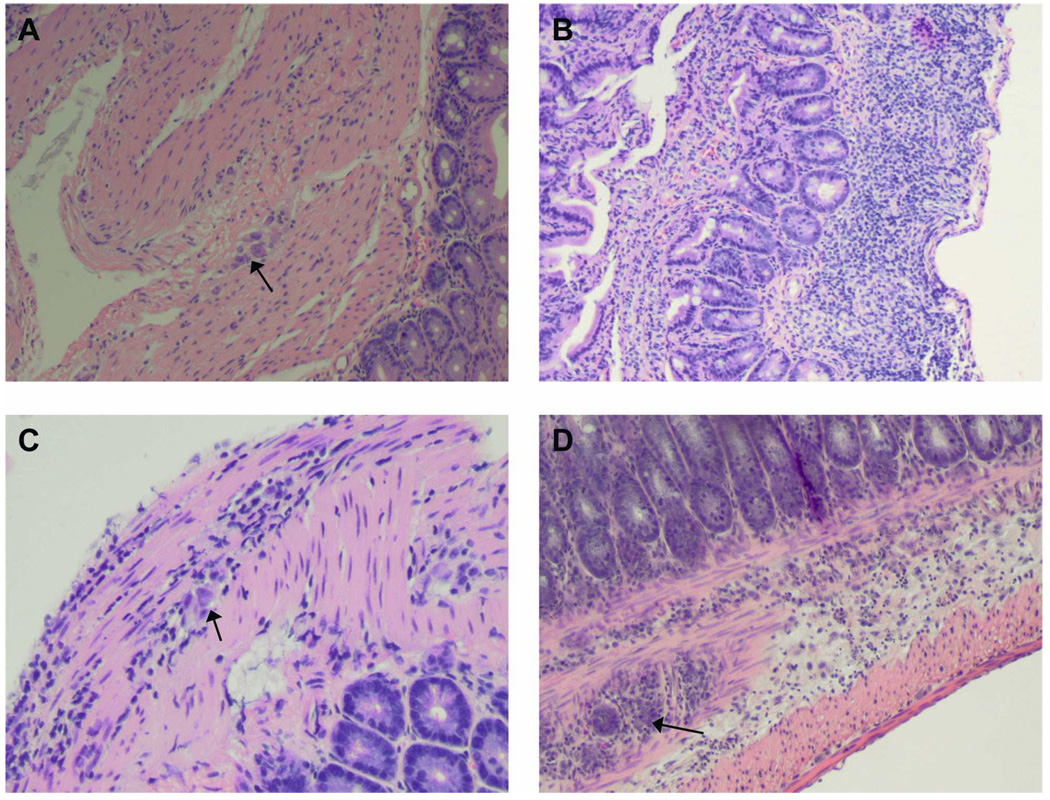
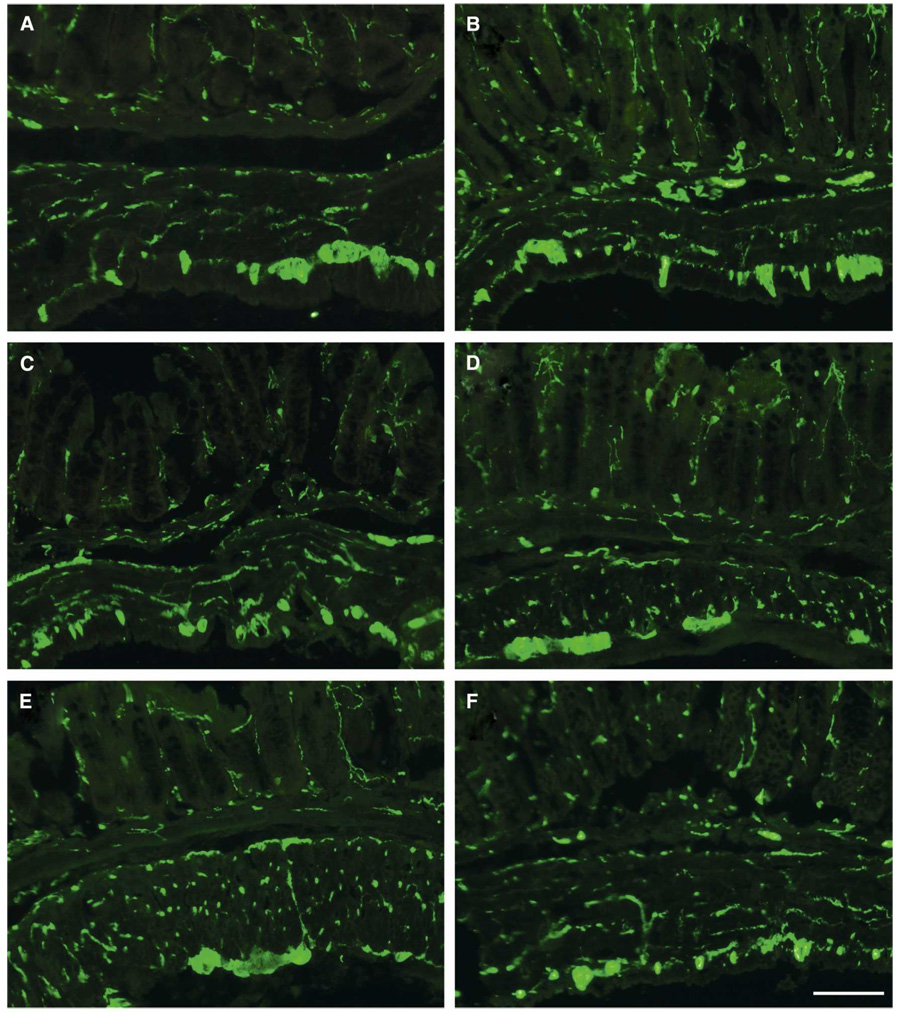
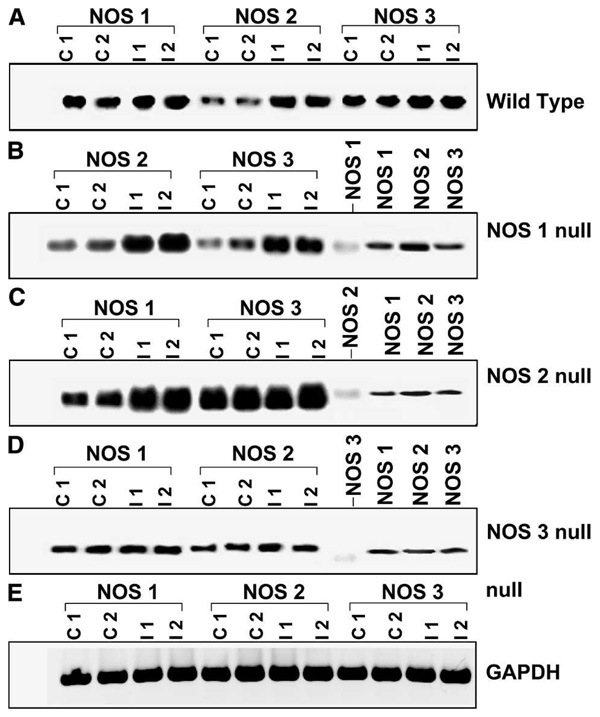
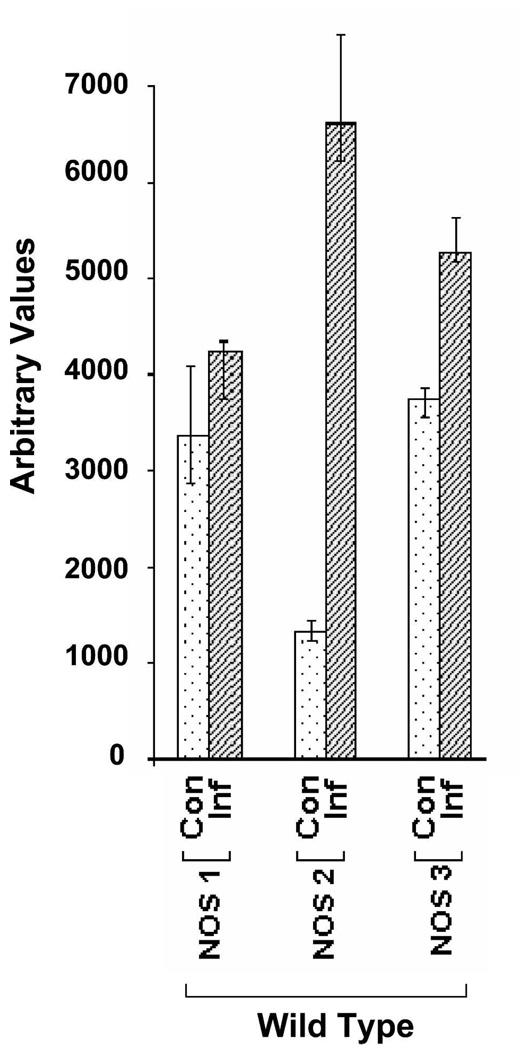
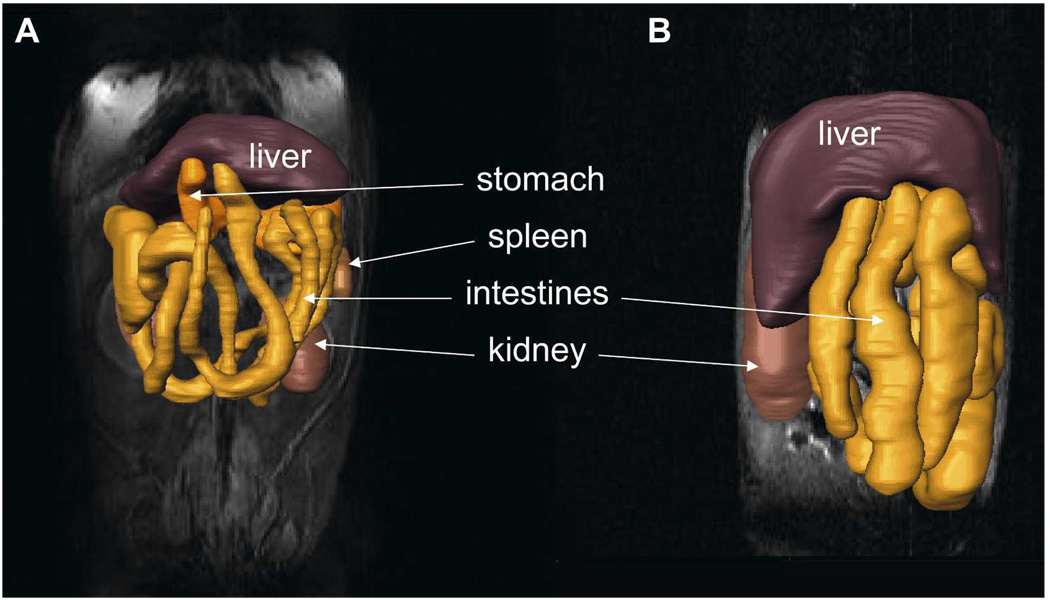
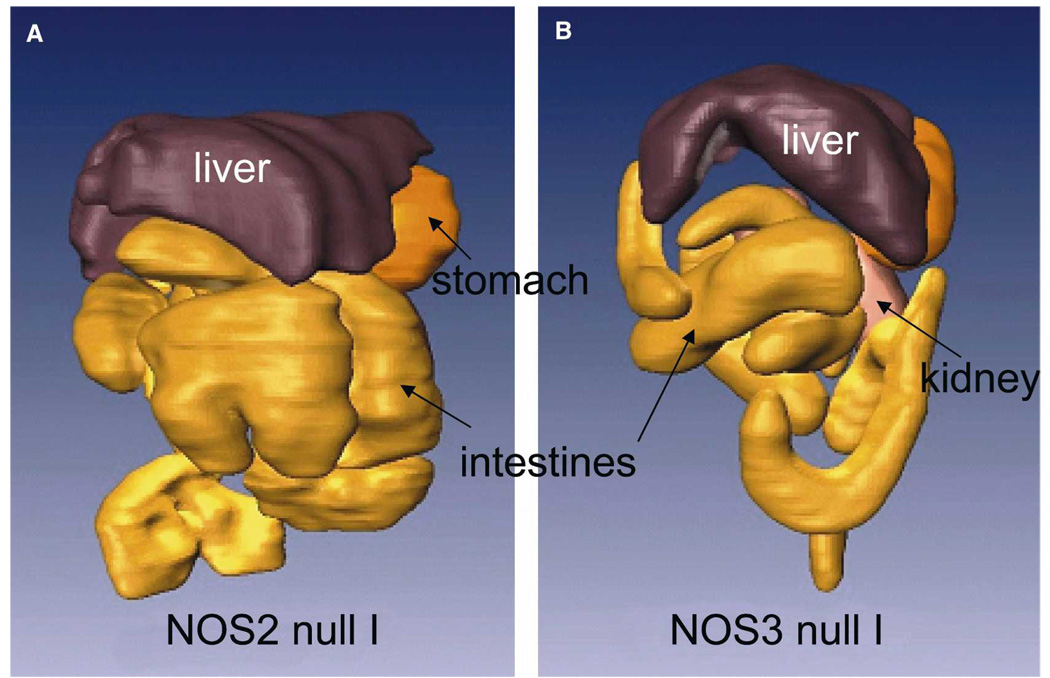
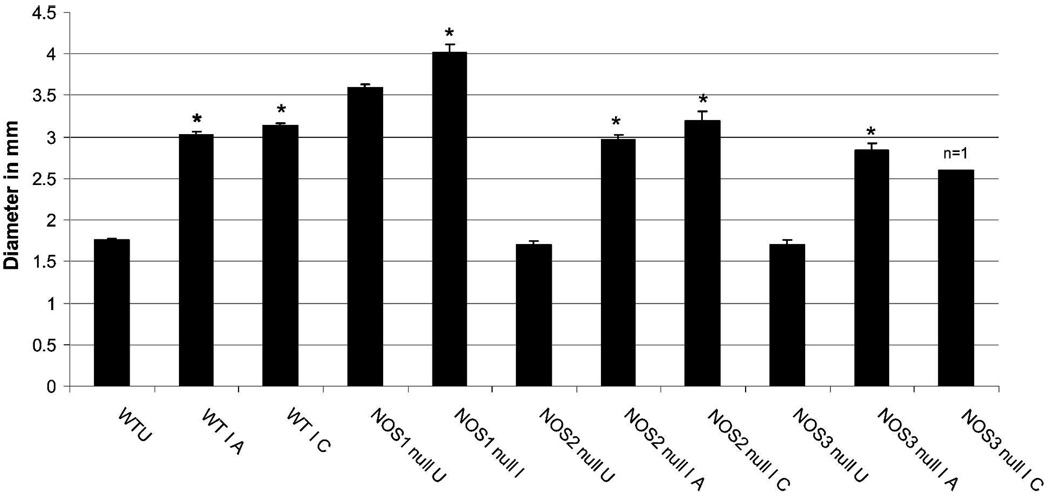
Infection with Trypanosoma cruzi causes megasyndromes of the gastrointestinal (GI) tract. We used magnetic resonance imaging (MRI) to monitor alterations in the GI tract of T. cruzi-infected mice, and to assess the role of nitric oxide (NO) in the development of intestinal dilation. Brazil strain-infected C57BL/6 wild-type (WT) mice exhibited dilatation of the intestines by 30 days post-infection. Average intestine lumen diameter increased by 72%. Levels of intestinal NO synthase (NOS) isoforms, NOS2 and NOS3, were elevated in infected WT mice. Inflammation and ganglionitis were observed in all infected mice. Intestinal dilation was observed in infected WT, NOS1, NOS2, and NOS3 null mice. This study demonstrates that MRI is a useful tool to monitor intestinal dilation in living mice and that these alterations may begin during acute infection. Furthermore, our data strongly suggests that NO may not be the sole contributor to intestinal dysfunction resulting from this infection.


Figures

FIGURE 1
FIGURE 1
Representative histology of colon obtained from infected mice. (A) Uninfected wild-type (WT) mouse. Note the normal ganglia (arrow, original magnification, 10×). (B) Infected NOS2 null mouse. Note the marked inflammatory response (original magnification, 10×). (C) Infected NOS2 null mouse. Note the ganglionitis (arrow, original magnification 20×). (D) Infected NOS2 null mouse. Note the marked inflammation and ganglionitis (arrow, original magnification, 10×). This figure appears in color at www.ajtmh.org.
FIGURE 2
FIGURE 2
Immunofluorescent images demonstrating protein gene product (PGP)-immunoreactivity in the intestinal wall of the mouse colon from (A) uninfected NOS1null, (B) infected NOS1 null, (C) uninfected NOS2 null, (D) infected NOS2 null, (E) uninfected wild-type (WT), and (F) infected WT. This figure appears in color at www.ajtmh.org.
FIGURE 3
FIGURE 3
Semi-quantitative reverse transcription-polymerase chain reaction (RT-PCR) for NOS isoforms in colon of wild-type (WT) and various NOS null mice. The top panel (A) shows various NOS isoform expression in WT control and infected mice. Representative gels of RT-PCR for NOS 2 and NOS 3 in NOS 1 null (B), NOS 1 and NOS 3 in NOS 2 null (C), and NOS 1 and NOS 2 in NOS 3 null (D), mouse colon infected with T. cruzi. Data from two independent control (C 1 and C 2) and infected (I 1 and I 2) samples from WT and each null mouse is shown. In panels (B), (C), and (D), the respective NOS null isoform was also amplified as a negative control. The right-hand side NOS 1, 2, and 3 are NOS positive controls, amplified from purified NOS cDNAs (as mentioned in Materials and Methods). Panel (e) shows GAPDH RT-PCR as an internal control, which remained the same in all NOS null mice regardless of infection status.
FIGURE 4
FIGURE 4
The relative contribution of NOS isoforms in mouse colon in T. cruzi infection. Semi-quantitative reverse transcription-polymerase chain reaction (RT-PCR) data for NOS isoforms are presented graphically for wild-type (WT) infected mice. A significant over expression of both NOS2 and NOS3 isoforms was observed.
FIGURE 5
FIGURE 5
Three-dimensional reconstructions of the gastrointestinal (GI) tract from magnetic resonance imaging (MRI) images of (A) an uninfected wild-type (WT) mouse and (B) an infected WT mouse. The reconstructions are overlaid on the original MRI images. Several organs are indicated. This figure appears in color at www.ajtmh.org.
FIGURE 6
FIGURE 6
Three-dimensional reconstructions of the gastrointestinal (GI) tract from magnetic resonance imaging (MRI) images of (A) an infected NOS2 null mouse and (B) an infected NOS3 null mouse. Several organs are indicated. This figure appears in color at www.ajtmh.org.
FIGURE 7
FIGURE 7
Intestine lumen diameter measured at the region of the kidney in transverse magnetic resonance imaging (MRI) images. Lumen diameter was compared at the acute (A, 30 dpi) and chronic (C, 60 dpi) for all groups except NOS1 (no infected NOS1 null mice survived to the 60 days time point). Wild-type uninfected (WTU) is the average of 29 measurements (4 mice); WT I A (wild type infected, 30 dpi) is the average of 31 measurements (5 mice); WT I C (wild type infected, 60 dpi) is the average of 10 measurements (2 mice); NOS1 null U (NOS1 null uninfected) = 55 measurements (9 mice); NOS1 null I A (NOS1 null infected, 30 dpi) = 23 measurements (5 mice); NOS2 null U (NOS2 null uninfected) = 29 measurements (5 mice); NOS2 null I A (NOS2 null infected, 30 dpi) = 42 measurements (7 mice); NOS2 null I C (NOS2 null infected, 60 dpi) = 12 measurements (2 mice); NOS3 null U (NOS3 null uninfected) = 28 measurements (4 mice); NOS3 null I A (NOS3 null infected) = 18 measurements (3 mice); NOS3 null I C (NOS3 null infected) = 7 measurements (1 mouse). *Lumen diameter was significantly increased in all infected mouse groups compared with their respective uninfected groups (t test, P < 0.001 for WT, NOS2 null, and NOS3 null, and P = 0.018 for NOS2 null). The extent of increase in lumen diameter during acute versus chronic infection was not significantly different for the WT, NOS2 null, and NOS3 null mice.

Similar articles

Cited by

References

    1. Tait P, Allison D. Imaging of the gastrointestinal tract. Drugs Today (Barc) 2001;37:533–557. - PubMed
    1. Lomas DJ. Technical developments in bowel MRI. Eur Radiol. 2003;13:1058–1071. - PubMed
    1. Lawler LP, Fishman EK. Bladder imaging using multidetector row computed tomography, volume rendering, and magnetic resonance imaging. J Comput Assist Tomogr. 2003;27:553–563. - PubMed
    1. Bruel JM, Gallix B. Multidetector CT and MRI in diseases of the GI tract. J Radiol. 2003;84:499–513. - PubMed
    1. Boczko J, Tar M, Melman A, Jelicks LA, Wittner M, Factor SM, Zhao D, Hafron J, Weiss LM, Tanowitz HB, Christ GJ. Trypanosoma cruzi infection induced changes in the innervation, structure and function of the murine bladder. J Urol. 2005;173:1784–1788. - PubMed

Publication types

LinkOut - more resources