

Genetic influences on growth and body composition in mice: multilocus interactions
- PMID: 18982013
- PMCID: PMC3206648
- DOI: 10.1038/ijo.2008.215
Genetic influences on growth and body composition in mice: multilocus interactions
Abstract
Background: The genetic architecture of body weight and body composition is complex because these traits are normally influenced by multiple genes and their interactions, even after controlling for the environment. Bayesian methodology provides an efficient way of estimating these interactions.
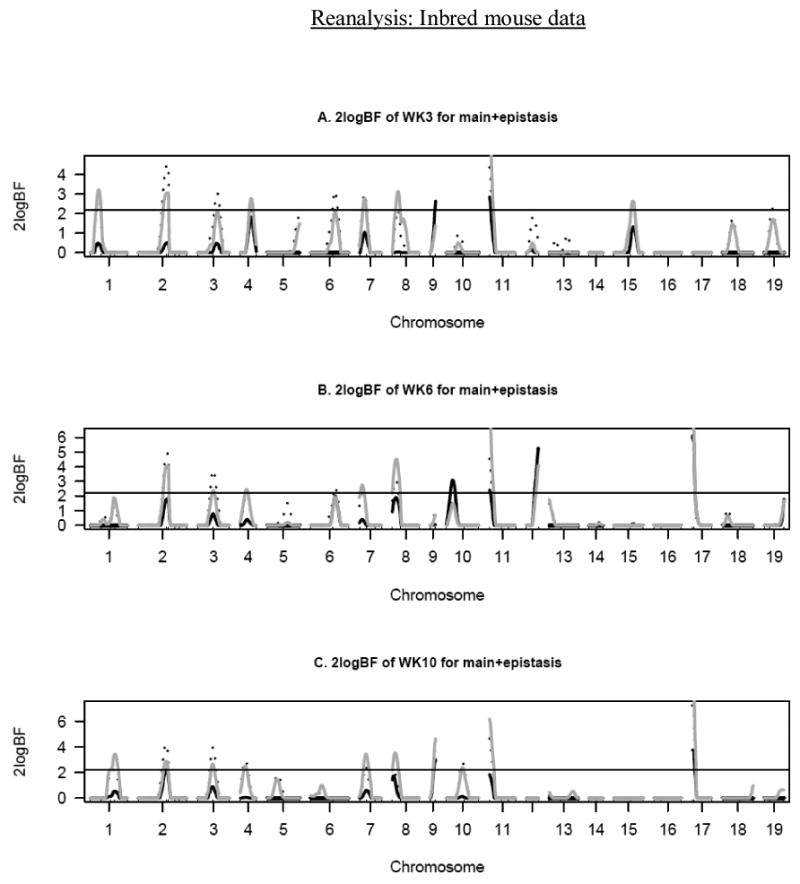
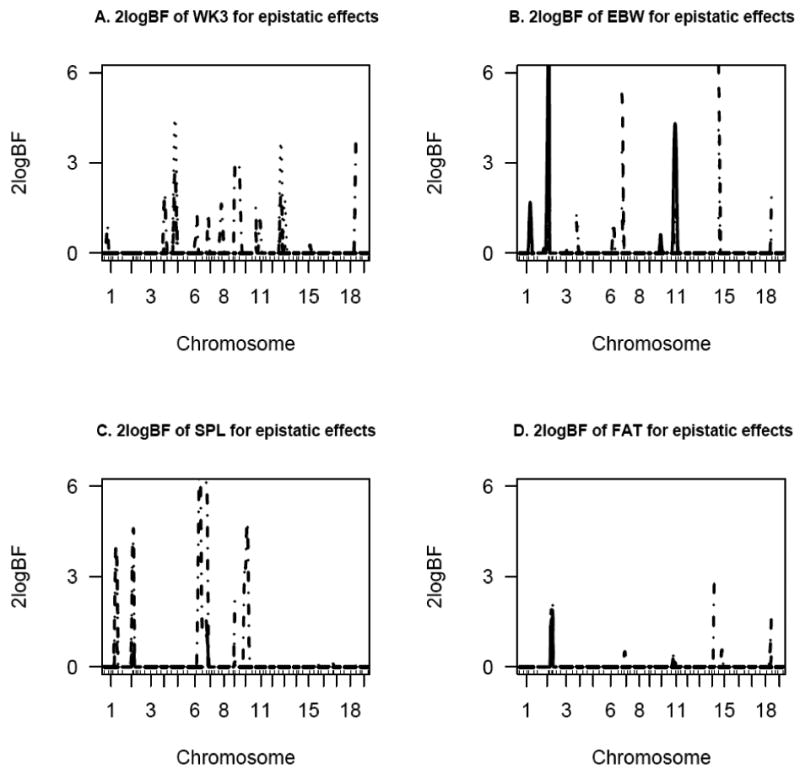
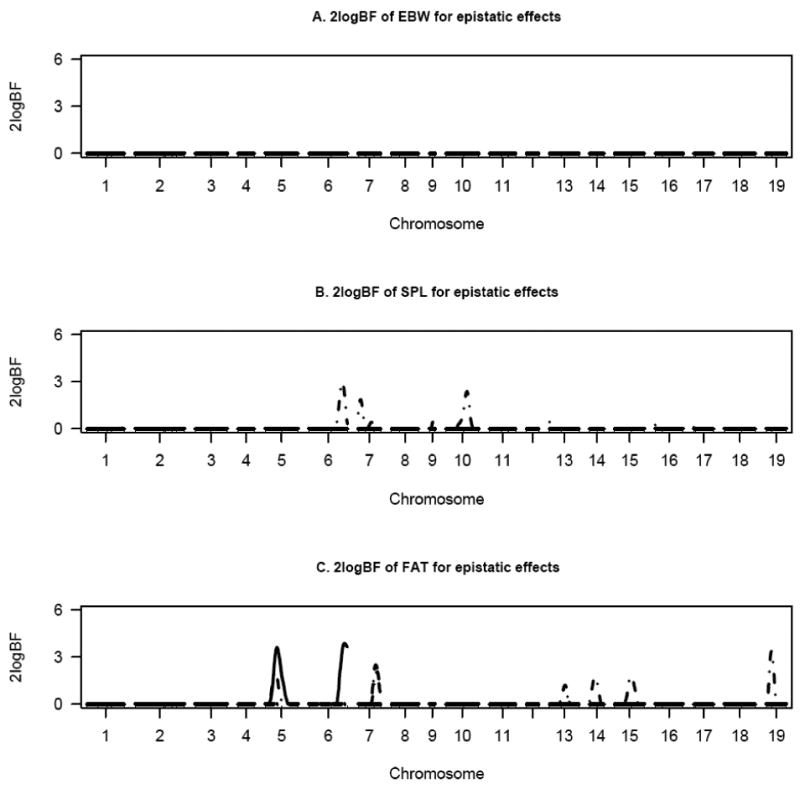
Subjects and measurements: We used Bayesian model selection techniques to simultaneously estimate the main effects, epistasis and gene-sex interactions on age-related body weight (at 3, 6 and 10 weeks, denoted as WT3wk, WT6wk and WT10wk) and body composition (organ weights and fat-related traits) in an F(2) sample obtained from a cross between high-growth (M16i) mice and low-growth (L6) mice.
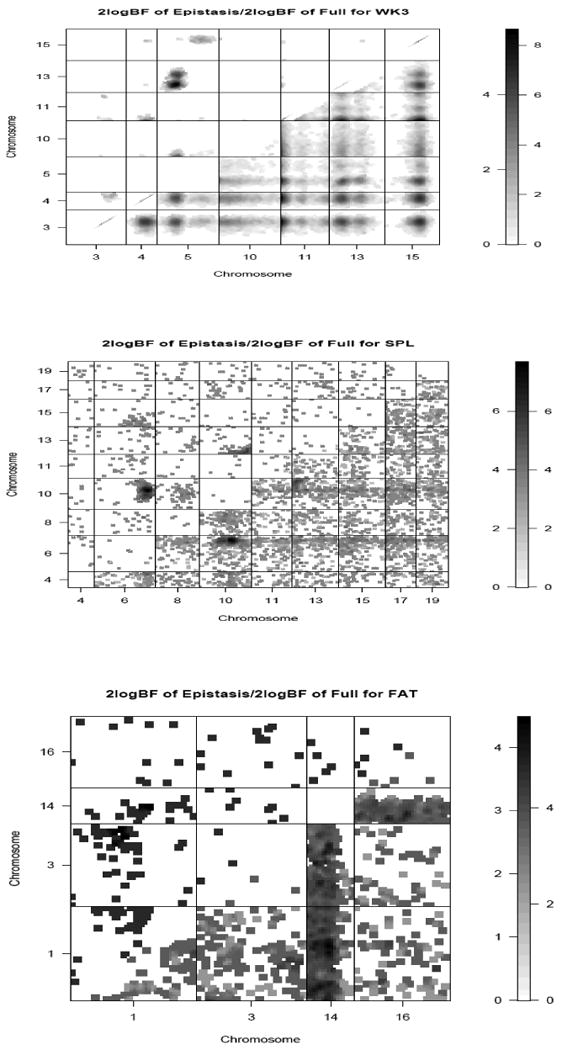
Results: We observed epistatic and main-effect quantitative trait loci (QTL) that controlled both body weight and body composition. Epistatic effects were generally more significant for WT6wk than WT10wk. Chromosomes 5 and 13 interacted strongly to control body weight at 3 weeks. A pleiotropic QTL on chromosome 2 was associated with body weight and some body composition phenotypes. Testis weight was regulated by a QTL on chromosome 13 with a significantly large main effect (2log(e)BF approximately 15).
Conclusion: By analyzing epistatic interactions, we detected QTL not found in a previous analysis of this mouse population. Hence, the detection of gene-gene interactions may provide new information about the genetic architecture of complex obesity-related traits and may lead to the detection of additional obesity genes.
Figures
Similar articles
-
Bayesian analyses of multiple epistatic QTL models for body weight and body composition in mice.Genet Res. 2006 Feb;87(1):45-60. doi: 10.1017/S0016672306007944. Genet Res. 2006. PMID: 16545150 Free PMC article.
-
Mapping main, epistatic and sex-specific QTL for body composition in a chicken population divergently selected for low or high growth rate.BMC Genomics. 2010 Feb 11;11:107. doi: 10.1186/1471-2164-11-107. BMC Genomics. 2010. PMID: 20149241 Free PMC article.
-
Characterization of epistasis influencing complex spontaneous obesity in the BSB model.Genetics. 2004 May;167(1):399-409. doi: 10.1534/genetics.167.1.399. Genetics. 2004. PMID: 15166164 Free PMC article.
-
Epistatic analysis of carcass characteristics in pigs reveals genomic interactions between quantitative trait loci attributable to additive and dominance genetic effects.J Anim Sci. 2010 Jul;88(7):2219-34. doi: 10.2527/jas.2009-2266. Epub 2010 Mar 12. J Anim Sci. 2010. PMID: 20228239
-
Body composition and gene expression QTL mapping in mice reveals imprinting and interaction effects.BMC Genet. 2013 Oct 29;14:103. doi: 10.1186/1471-2156-14-103. BMC Genet. 2013. PMID: 24165562 Free PMC article.
Cited by
-
Systems genetics analysis of body weight and energy metabolism traits in Drosophila melanogaster.BMC Genomics. 2010 May 11;11:297. doi: 10.1186/1471-2164-11-297. BMC Genomics. 2010. PMID: 20459830 Free PMC article.
-
Mapping novel genetic loci associated with female liver weight variations using Collaborative Cross mice.Animal Model Exp Med. 2018 Oct 24;1(3):212-220. doi: 10.1002/ame2.12036. eCollection 2018 Sep. Animal Model Exp Med. 2018. PMID: 30891567 Free PMC article.
-
A longitudinal quantitative trait locus mapping of chicken growth traits.Mol Genet Genomics. 2019 Feb;294(1):243-252. doi: 10.1007/s00438-018-1501-y. Epub 2018 Oct 12. Mol Genet Genomics. 2019. PMID: 30315370
-
Something old and something new: wedding recombinant inbred lines with traditional line cross analysis increases power to describe gene interactions.PLoS One. 2010 Apr 16;5(4):e10200. doi: 10.1371/journal.pone.0010200. PLoS One. 2010. PMID: 20419131 Free PMC article.
-
Genetic architecture of quantitative traits in mice, flies, and humans.Genome Res. 2009 May;19(5):723-33. doi: 10.1101/gr.086660.108. Genome Res. 2009. PMID: 19411597 Free PMC article.
References
MeSH terms
Grants and funding
LinkOut - more resources
Full Text Sources
Molecular Biology Databases
Miscellaneous
