. 2008 Jul 14;2(1):114-22.
doi: 10.3389/neuro.01.003.2008. eCollection 2008 Jul.

Can attractor network models account for the statistics of firing during persistent activity in prefrontal cortex?

Affiliations

Can attractor network models account for the statistics of firing during persistent activity in prefrontal cortex?

Francesca Barbieri et al. Front Neurosci. .

Abstract

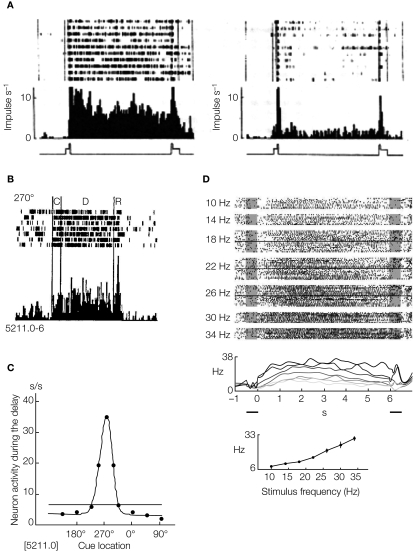
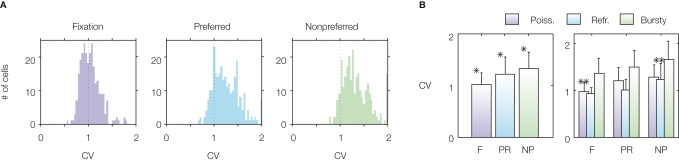
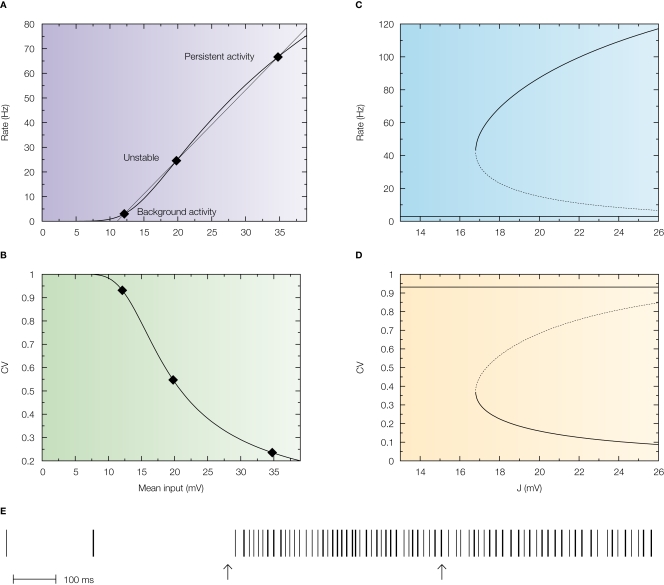
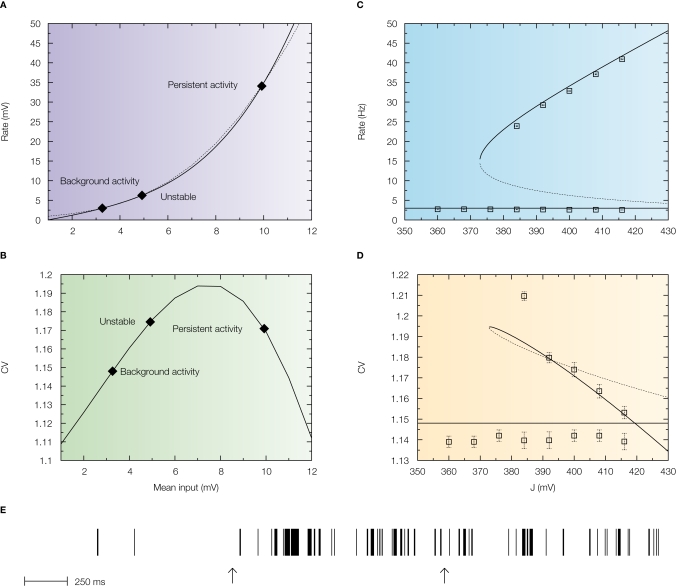
Persistent activity observed in neurophysiological experiments in monkeys is thought to be the neuronal correlate of working memory. Over the last decade, network modellers have strived to reproduce the main features of these experiments. In particular, attractor network models have been proposed in which there is a coexistence between a non-selective attractor state with low background activity with selective attractor states in which sub-groups of neurons fire at rates which are higher (but not much higher) than background rates. A recent detailed statistical analysis of the data seems however to challenge such attractor models: the data indicates that firing during persistent activity is highly irregular (with an average CV larger than 1), while models predict a more regular firing process (CV smaller than 1). We discuss here recent proposals that allow to reproduce this feature of the experiments.

Keywords: integrate-and-fire neuron; network model; prefrontal cortex; short-term depression; working memory.


Figures

Figure 1
Figure 1
Experimental evidence of persistent activity. (A) Persistent activity of a cell in IT cortex of a monkey performing a DMS task. Raster and trial-averaged firing rate of in trials during which the picture that elicits the highest delay activity is shown as a sample (left) and trials when an unfamiliar picture is shown (right). From Miyashita (1988), reprinted by permission from Nature, © 1988 Macmillan Publishers Ltd. (B) Persistent activity of a cell in PFC of a monkey performing an ODR task. Raster and trial-averaged firing rate of a neuron when a cue is presented at 270 (top panel), the preferred cue location for that neuron (C: cue period; D: delay period; R: response period). From Funahashi et al. (1989), used with permission. (C) average firing rate during the delay period vs. cue location, for the neuron shown in (B). From Funahashi et al. (1989), used with permission. (D) Persistent activity of a cell in PFC of a monkey performing a delayed somatosensory discrimination task. Top panel: Rastergrams of a PFC cell arranged according to frequency of the base stimulus (indicated on the left). Middle panel: Trial averaged firing rate for several stimulus frequencies showing the monotonic response as a function of stimulus frequency. Bottom panel: Tuning curve of the cell in the delay period. From Romo et al. (1999), reprinted by permission from Nature, © 1989 Macmillan Publishers Ltd.
Figure 2
Figure 2
Schematic depiction of the space of states of an attractor network. Stable states are shown as filled circles. The represented network has one background state (shown schematically as a grey circle in the center) and several memory states (black circles). Arrows represents the dynamics of the network towards an attractor, following presentation of a stimulus. Lines represents the limits of the basin of attraction of each attractor. From Brunel (2004).
Figure 3
Figure 3
Variability of spiking activity of prefrontal neurons of monkeys performing an ODR task. Measures of ISI variability are high in all epochs of the task. From Compte et al. (2003), used with permission. (A) Distribution of CVs over recorded cells for each task condition (FIXATION, F): before stimulus presentation; PREFERRED (PR): delay period following the preferred stimulus; NONPREFERRED (NP): delay period following the non-preferred stimulus). (B) Mean and SD of the CV in each task condition. The right panel shows mean and SD of the CV for three classes of neurons (‘Poisson’, ‘Refractory’, and ‘Bursty’) defined according to features of their power spectrum. See Compte et al. (2003) for more details.
Figure 4
Figure 4
Standard attractor network models produce highly regular persistent activity. Mean firing rate and CV of a population of excitatory leaky integrate-and-fire neurons with low reset (10 mV below threshold) connected by linear excitatory synapses (see Barbieri and Brunel, for more details). (A) f-I curve (firing rate of a single LIF neuron as a function of mean input). The intersections between the f-I curve (thick line) of the LIF neuron and the straight line (thin line) correspond to solutions of the mean-field equation, shown by diamonds, for a particular value of the synaptic efficacy. The three solutions correspond to the background activity state (stable), the limit of the basin of attraction (unstable) and the persistent activity state (stable). (B) CV-I curve (CV of a single LIF neuron as a function of mean input). Diamonds: Values of the CV for the three states shown in (A). (C) Bifurcation diagram showing firing rate of the excitatory network as a function of synaptic strength J. The background activity corresponds to the horizontal curve (lowest branch), the dotted curve (intermediate branch) is the boundary of the basin of attraction and the black curve (highest branch) represents the evolution of the persistent activity. (D) Bifurcation diagram showing how the CV depends on J: the persistent activity (black curve, lowest branch) has a CV which is well below the CV of the background activity (highest branch, red curve) for all values of J. (E) Spike train of one of the cells of the network (simulation of a network of 1000 neurons). Arrows indicate beginning and end of presentation of the stimulus, so the second arrow indicates the beginning of the delay period. Note the high regularity of the spike train in the delay period.
Figure 5
Figure 5
An excitatory network with high reset potentials of individual neurons and short-term depression of excitatory synapses produce highly irregular persistent activity. Mean firing rate and CV of a population of excitatory leaky integrate-and-fire neurons with high reset (5 mV below threshold) connected by excitatory synapses with short-term depression (see Barbieri and Brunel, for more details). (A) f-I curve (solid line) plotted together with the current-rate relationship for synapses with short-term depression (dotted curve). Intersections between these two curves (diamonds) yield the solutions of the mean-field equation. They correspond to background, unstable and persistent fixed points, respectively. (B) CV-I curve. Diamonds: Values of the CV for the three intersection points shown in (A). (C) Bifurcation diagram showing firing rate vs. J. The black curve correspond to the persistent state (stable), the dotted one to the boundary of the basin of attraction (unstable) and the horizontal one to the background state (stable). (mean-field: lines; simulations: symbols). (D) CV vs. J bifurcation diagram. There exists a finite range of values of the synaptic efficacy for which the CV in the persistent state is larger than in the background one (370 mV < J < 420 mV in the figure). Mean-field: lines; simulations: symbols. (E) Spike train of one cell in a simulated network of 1000 neurons; arrows indicate beginning and end of the stimulus presentation. Note the high irregularity of this spike train during the delay period, contrary to the one shown in Figure 4.

References

    1. Amari S.-I. (1972). Learning patterns and pattern sequences by self-organizing nets of threshold elements. IEEE Trans. Comput. C-21, 1197–120610.1109/T-C.1972.223477 - DOI
    1. Amit D. J. (1995). The Hebbian paradigm reintegrated: local reverberations as internal representations. Behav. Brain Sci. 18, 617–657
    1. Amit D. J., Brunel N. (1997). Model of global spontaneous activity and local structured activity during delay periods in the cerebral cortex. Cereb. Cortex 7, 237–25210.1093/cercor/7.3.237 - DOI - PubMed
    1. Amit D. J., Fusi S., Yakovlev V. (1997). Paradigmatic working memory (attractor) cell in IT cortex. Neural Comput. 9, 1071–109210.1162/neco.1997.9.5.1071 - DOI - PubMed
    1. Amit D. J., Tsodyks M. V. (1991a). Quantitative study of attractor neural network retrieving at low spike rates. I. Substrate – spikes, rates and neuronal gain. Network 2, 259–27410.1088/0954-898X/2/3/003 - DOI

LinkOut - more resources