. 2007 Oct 15;1(1):131-43.
doi: 10.3389/neuro.01.1.1.010.2007. eCollection 2007 Nov.

Ultrastructure of dendritic spines: correlation between synaptic and spine morphologies

Affiliations

Ultrastructure of dendritic spines: correlation between synaptic and spine morphologies

Jon I Arellano et al. Front Neurosci. .

Abstract

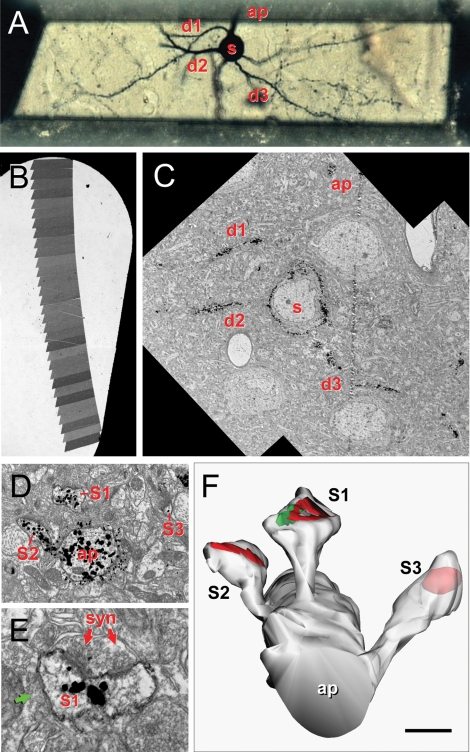
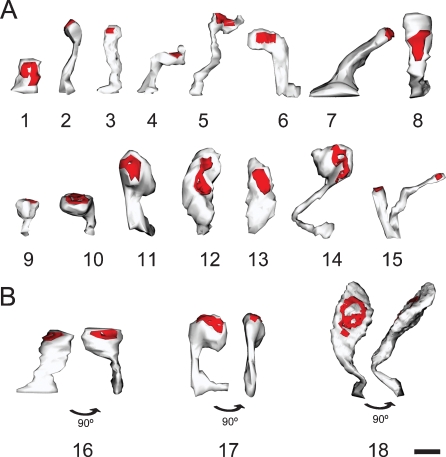
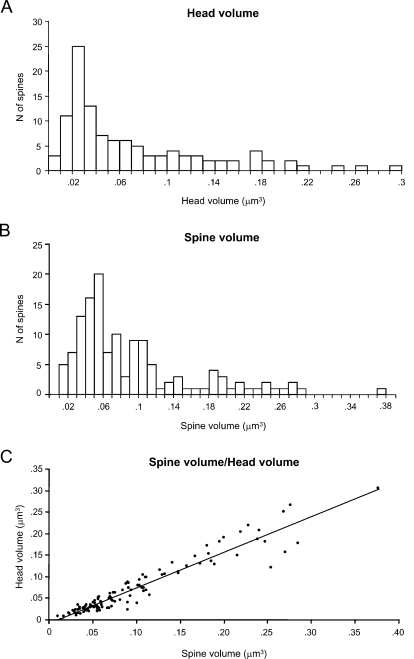
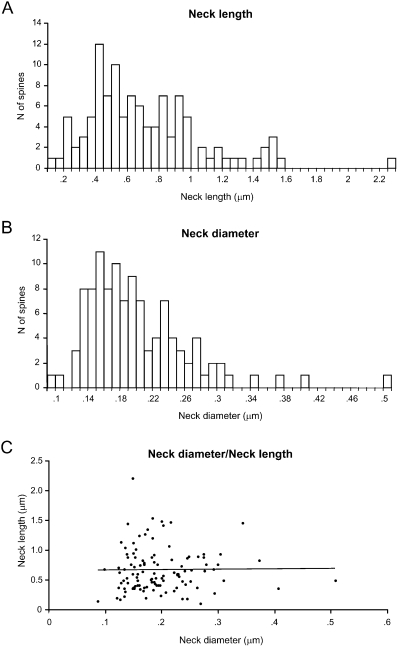
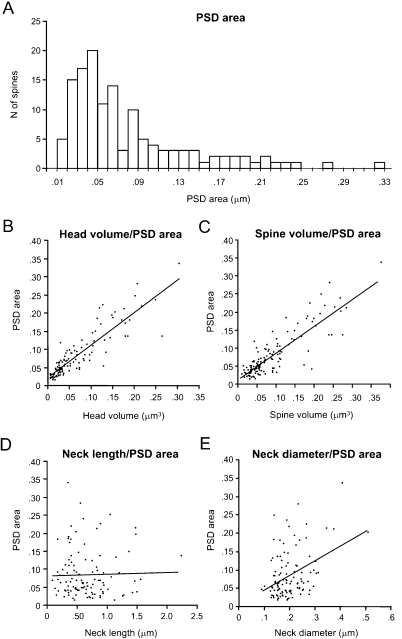
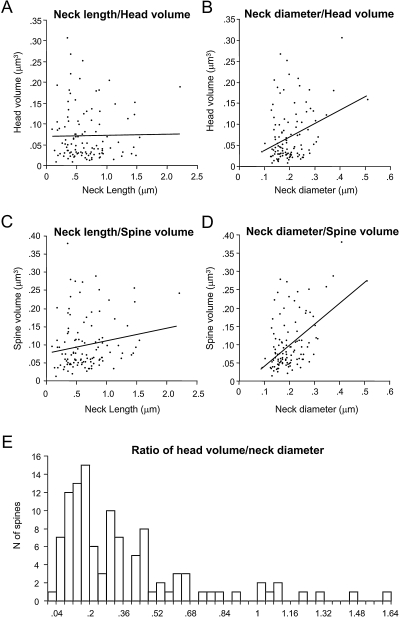
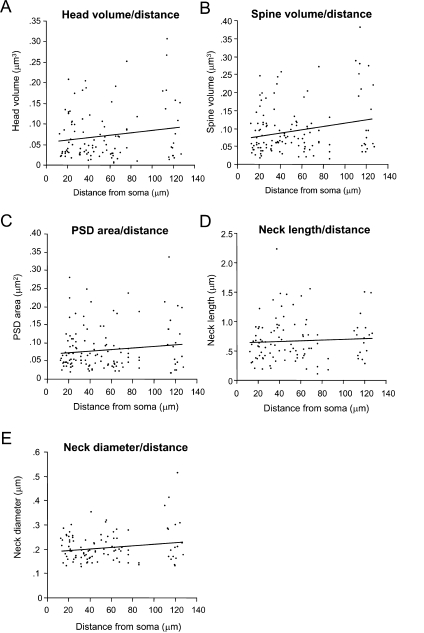
Dendritic spines are critical elements of cortical circuits, since they establish most excitatory synapses. Recent studies have reported correlations between morphological and functional parameters of spines. Specifically, the spine head volume is correlated with the area of the postsynaptic density (PSD), the number of postsynaptic receptors and the ready-releasable pool of transmitter, whereas the length of the spine neck is proportional to the degree of biochemical and electrical isolation of the spine from its parent dendrite. Therefore, the morphology of a spine could determine its synaptic strength and learning rules.To better understand the natural variability of neocortical spine morphologies, we used a combination of gold-toned Golgi impregnations and serial thin-section electron microscopy and performed three-dimensional reconstructions of spines from layer 2/3 pyramidal cells from mouse visual cortex. We characterized the structure and synaptic features of 144 completed reconstructed spines, and analyzed their morphologies according to their positions. For all morphological parameters analyzed, spines exhibited a continuum of variability, without clearly distinguishable subtypes of spines or clear dependence of their morphologies on their distance to the soma. On average, the spine head volume was correlated strongly with PSD area and weakly with neck diameter, but not with neck length. The large morphological diversity suggests an equally large variability of synaptic strength and learning rules.

Keywords: PSD; Pyramidal; electron microscopy; serial section.


Figures

Figure 1
Figure 1
Correlative optical-electron microscopy. (A) Trimmed resin block containing a selected Golgi-impregnated gold-toned neuron. The soma (s), some basal dendrites (d1–d3) bearing dendritic spines and the beginning of the apical dendrite (ap) are indicated. (B) Slot grid with a ribbon of serial sections for ultrastructural analysis. (C) Electron microscopic panoramic images of the neuron in A; the soma (s), d1–d3 basal dendrites and the apical (ap) dendrite are indicated. (D) Detail of the apical dendrite (ap) with three spines (s1, s2, s3). (E) Detail of the asymmetrical synapse (syn) on s1; note the perforated PSD, the synaptic cleft and the presynaptic terminal with rounded vesicles. This spine also established a symmetrical synapse (green arrow). (F) Three-dimensional reconstruction of the same apical dendritic segment; the rendering has been slightly shifted down to show the synaptic junctions and S3 is partially transparent to show the location of the PSD. Scale bar is 24 μm in A; 250 μm in B; 10 μm in C; 1 μm in D; 0.3 μm in E, and 0.6 μm in F.
Figure 2
Figure 2
Morphological variability of spines. Three-dimensional reconstruction of spines showing the variability in their morphology. (A) Spines showing different types: stubby (1), thin (2), mushroom (9–11), and ramified (15). We would caution the reader that most reconstructed spines were atypical or intermediate types (3–8, 12–14). (B) Spines appear different depending on the angle of observation. 16–18 illustrate three spines from two points of view after 90° rotation. Scale bar is 0.5 μm.
Figure 3
Figure 3
Analysis of spine volumes.
Figure 4
Figure 4
Analysis of spine neck diameters and lengths.
Figure 5
Figure 5
Analysis of spine PSD areas.
Figure 6
Figure 6
Correlation between spine head and neck variables.
Figure 7
Figure 7
Lack of correlation between spine morphology and distance to soma.

References

    1. Araya R., Eisenthal K. B., Yuste R. (2006a). Dendritic spines linearize the summation of excitatory potentials. Proc. Natl. Acad. Sci. USA 103, 18779–18804 - PMC - PubMed
    1. Araya R., Jiang J., Eisenthal K. B., Yuste R. (2006b). The spine neck filters membrane potentials. Proc. Natl. Acad. Sci. USA 103, 17961–17966 10.1073/pnas.0608755103 - DOI - PMC - PubMed
    1. Arellano J. I., Espinosa A., Fairen A., Yuste R., DeFelipe J. (2007). Non-synaptic dendritic spines in neocortex. Neuroscience 145, 464–469 10.1016/j.neuroscience.2006.12.015 - DOI - PubMed
    1. Ballesteros-Yanez I., Benavides-Piccione R., Elston G., Yuste R., DeFelipe J. (2006). Density and morphology of dendritic spines in mouse neocortex. Neuroscience. 138, 403–409 10.1016/j.neuroscience.2005.11.038 - DOI - PubMed
    1. Bekkers J. M., Richerson G. B., Stevens C. F. (1990). Origin of variability in quantal size in cultured hippocampal neurons and hippocampal slices. Proc. Natl. Acad. Sci. USA 87, 5359–5362 10.1073/pnas.87.14.5359 - DOI - PMC - PubMed

LinkOut - more resources